
- Pivot High – 1974
- Pivot Low – 1968
- Opening Range High – 1985
- Opening Range Low – 1952
Last six months
Pivot High – 1924
Pivot Low – 1852
Last six months
Pivot High – 1924
Pivot Low – 1852
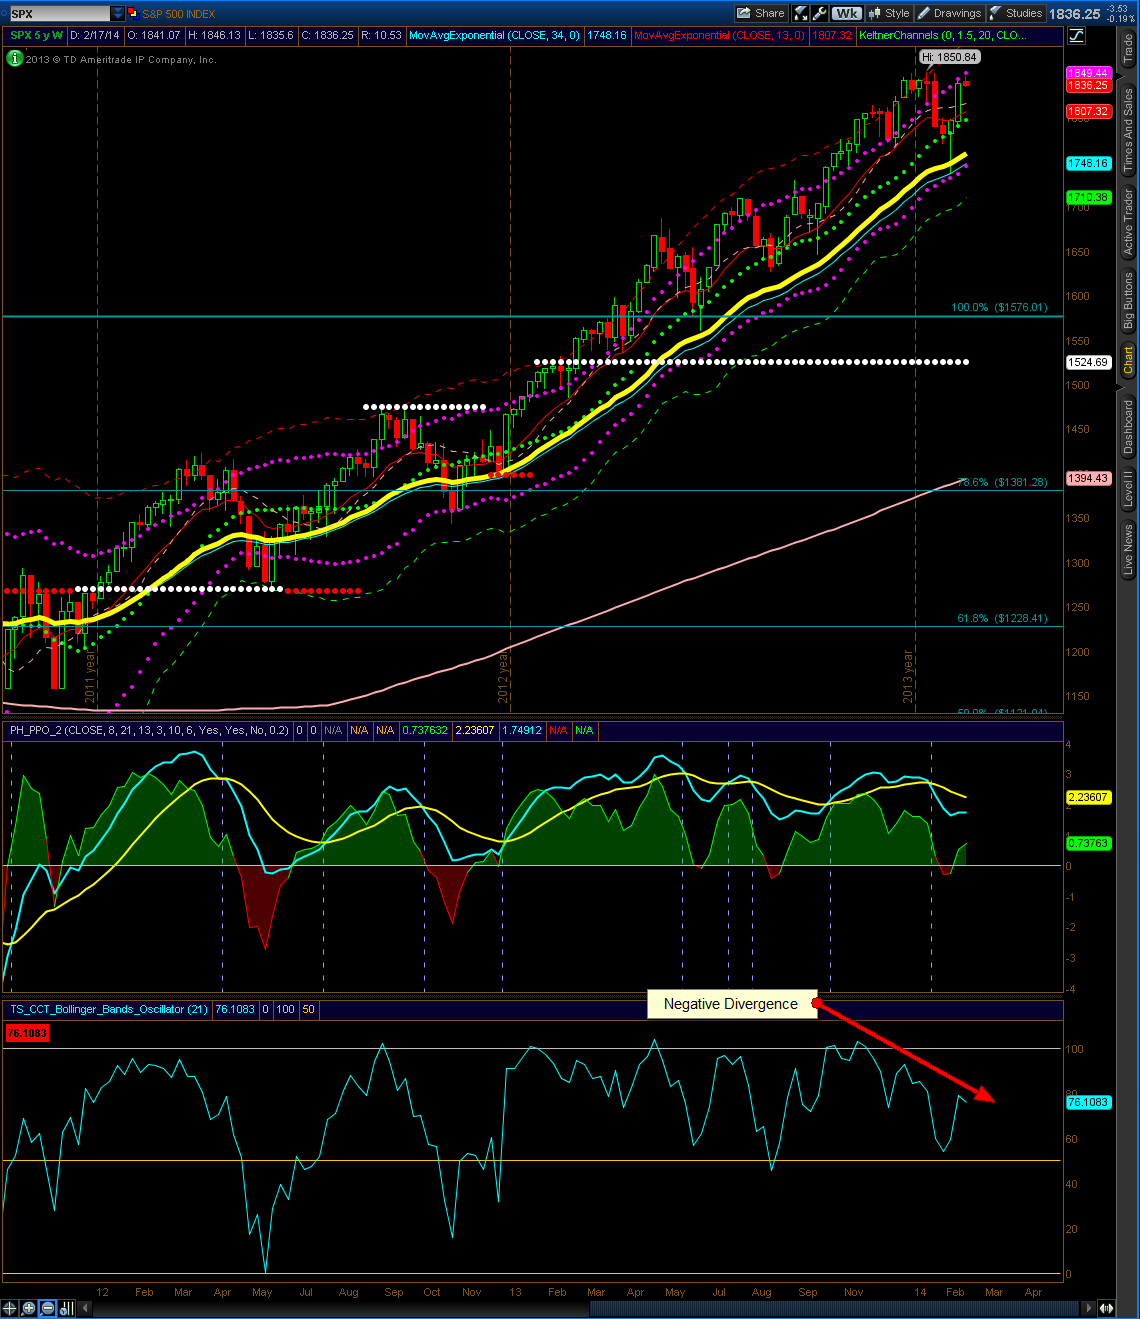
The S&P 500 weekly is showing a close inside the six month opening range. The sell off from previous highs held near weekly support close to 1836. On a rally, I expect the upper Keltner line to be tested near 1868, while a sell off through support could retest 1815.
The weekly outlook is neutral to bullish.
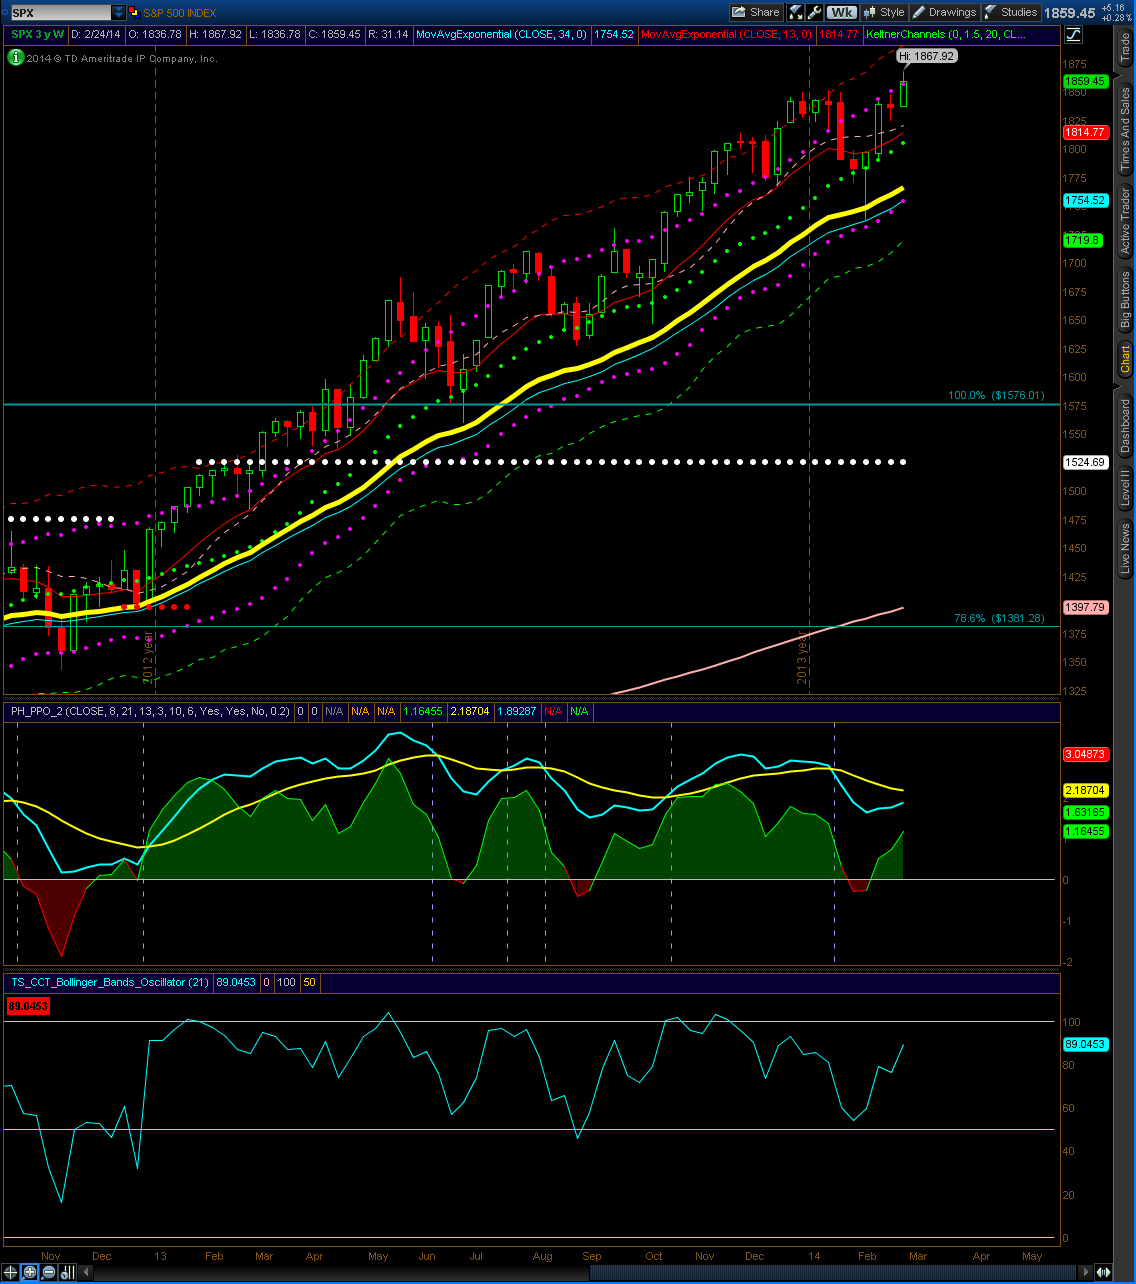
The S&P 500 weekly is showing another new high along with a close above the upper Keltner channel.
This is also the first close above the 6 month opening range.
Until sustained weakness is shown, the weekly outlook is bullish.
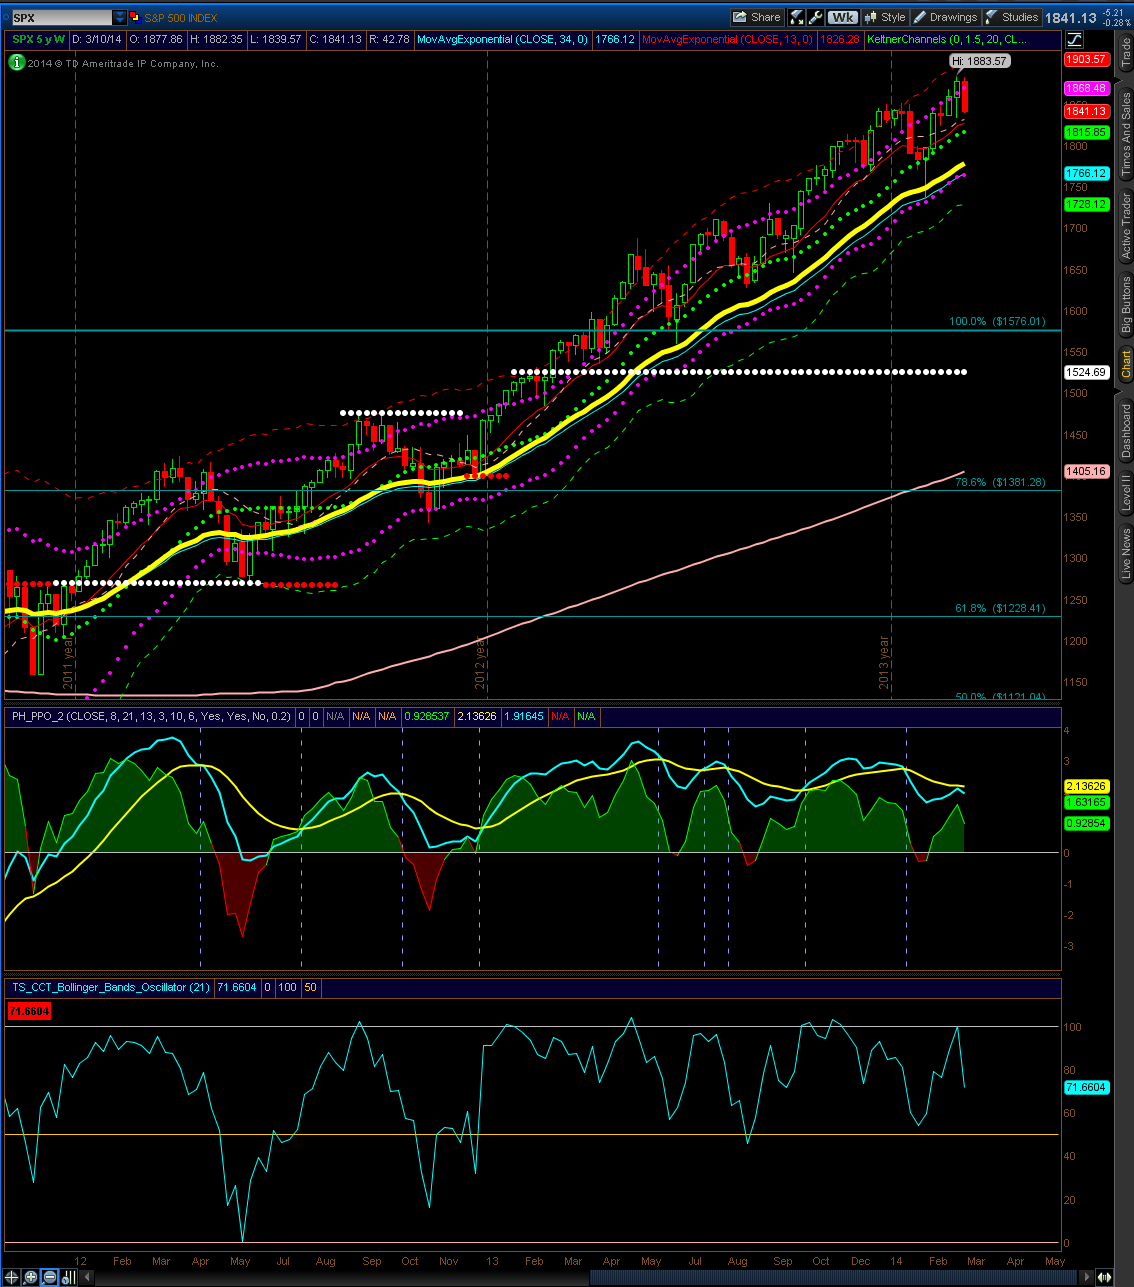
The S&P 500 Weekly is showing a close right below the upper Keltner line. If the market rallies above 1849, new highs will be made, while a sell off could retest 1800 or lower.
This is the second week that the market has closed back in the six month opening range.
The CCT indicator is showing negative divergence or waning momentum in the rally.
The weekly outlook is neutral to bullish.
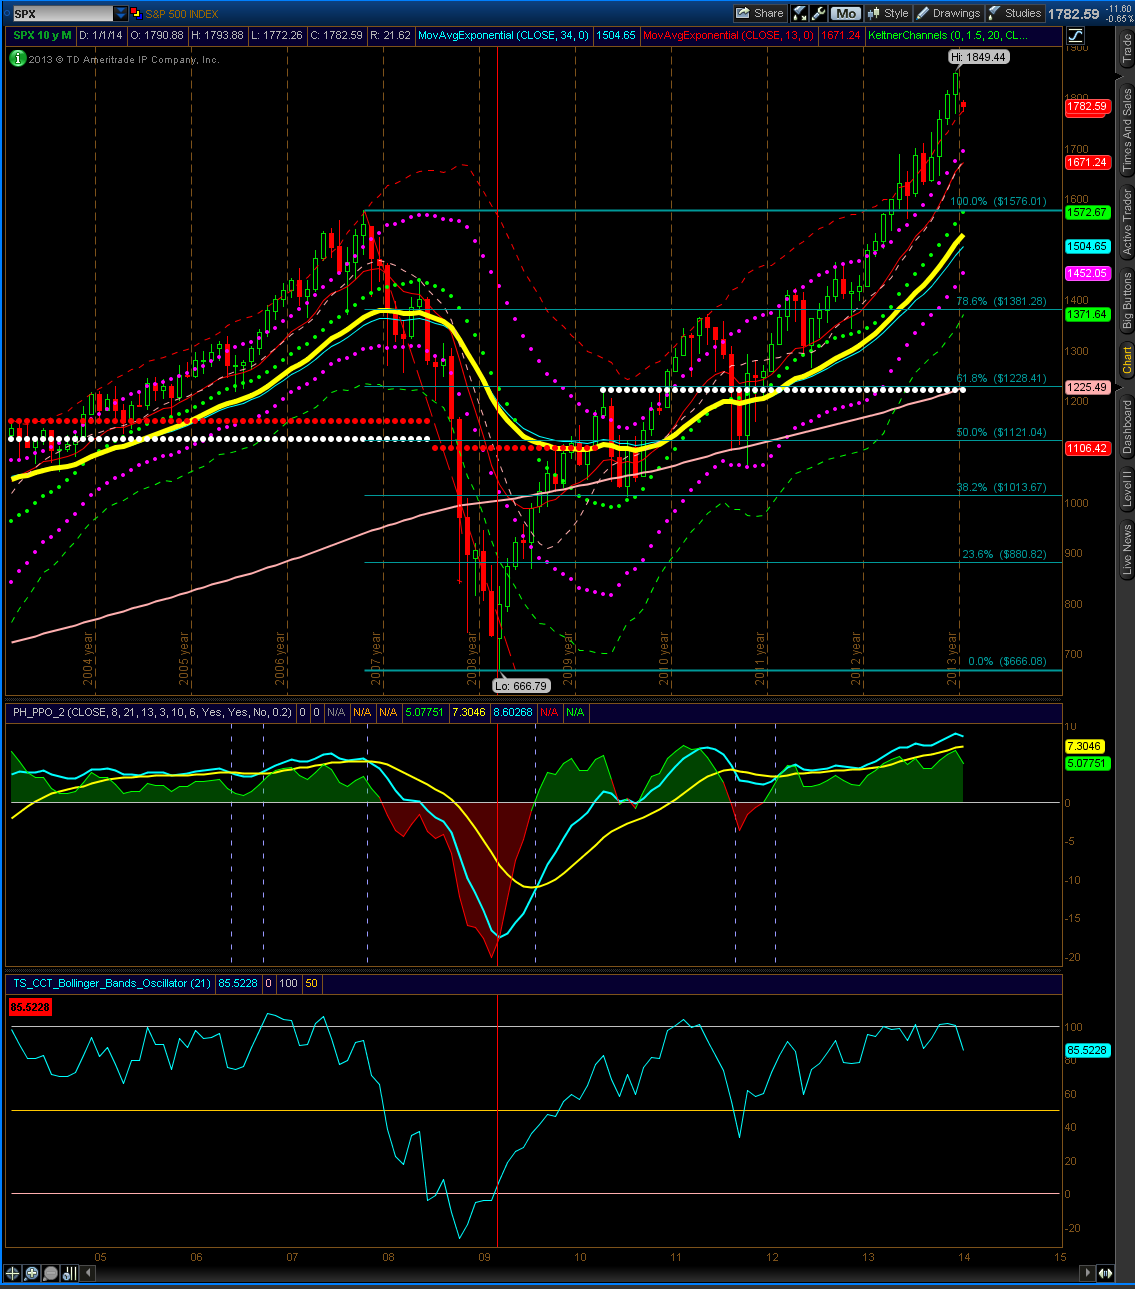
The S&P 500 Monthly candle opened at 1845 and closed at 1782. On further weakness, 1695 may be tested, while a rally may retest highs near 1850. The monthly outlook remains cautiously bullish.
Although on a monthly chart, the outlook clearly remains bullish, the market has closed beneath the opening range for the S&P 500 cash, which is the following:
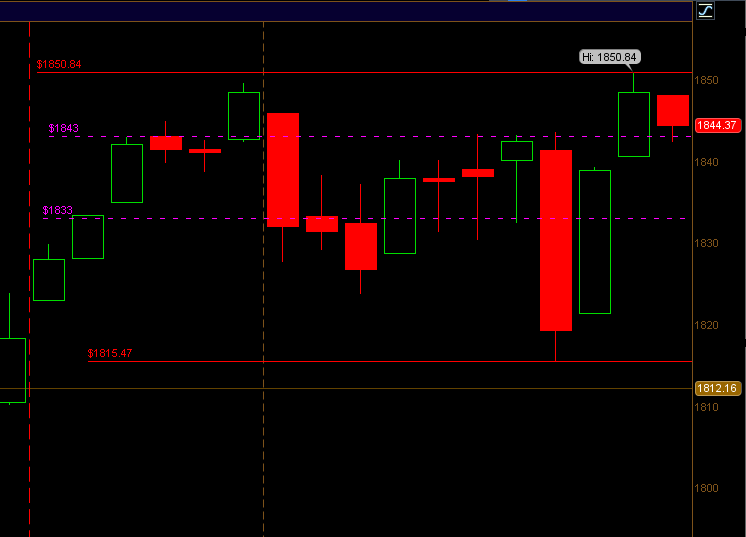
As long as the market remains below 1815, a sell off for the first half of the year remains a strong possibility.