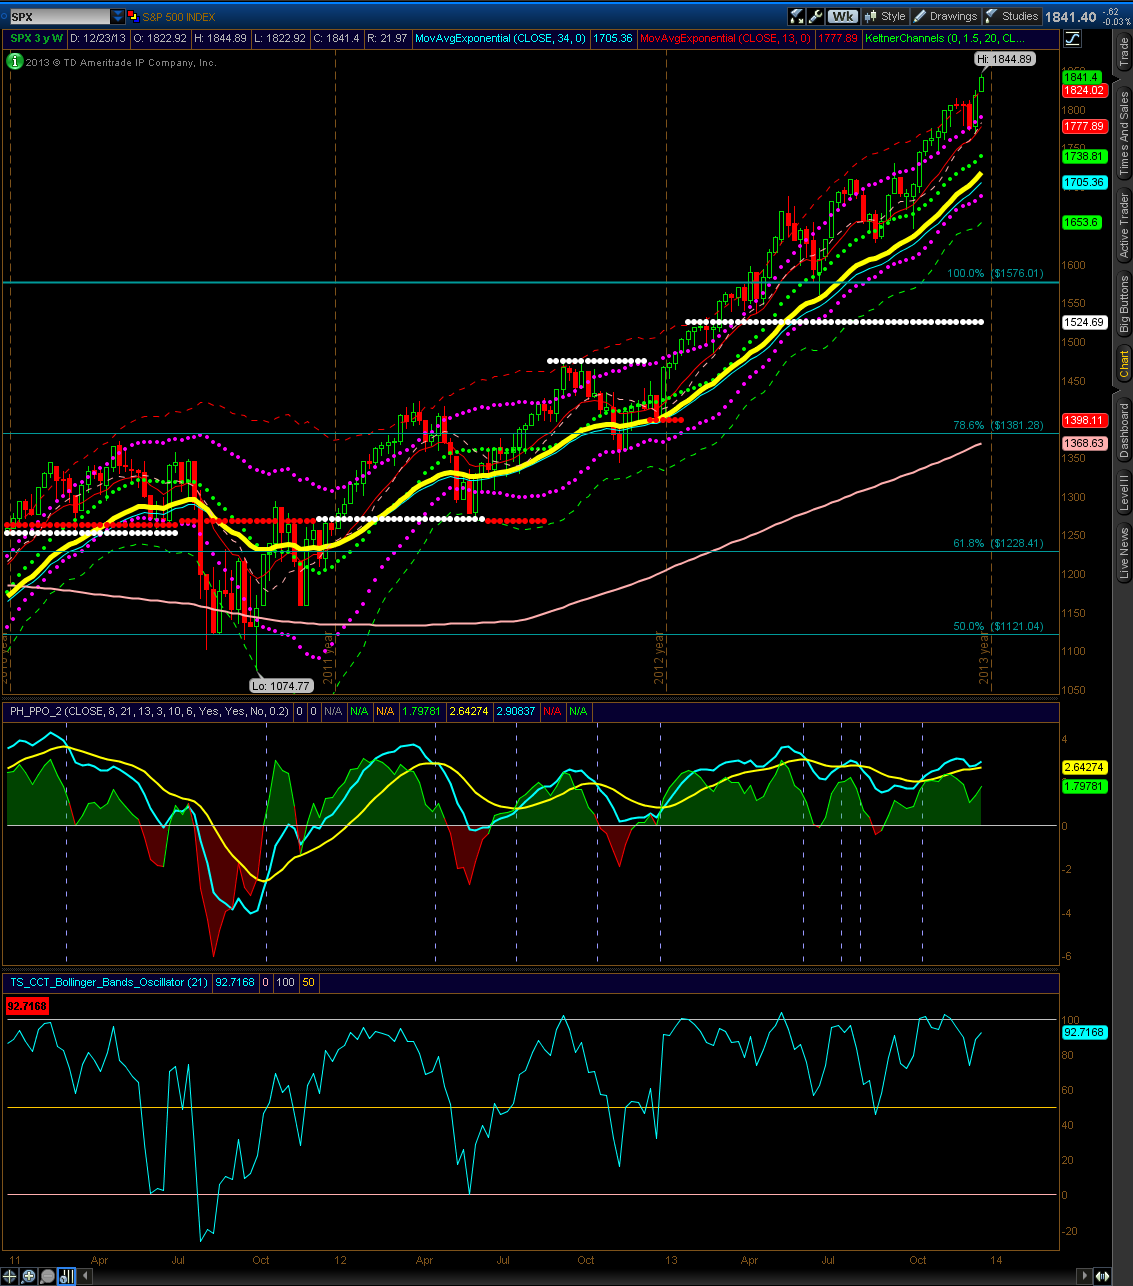
S&P 500 Weekly Review July 22 – 26

The S&P 500 weekly is showing a close slightly below last week. In the event of a rally, I expect 1714 to be tested, while a sell off may retest the 1650s. The market also closed above the 2 week opening range for the 2nd consecutive week. The daily chart is showing support near 1684.

Until the market shows sustained weakness, my outlook remains bullish.


S&P 500 Weekly Review July 15 – 19

The S&P 500 weekly is showing a new all time high. The daily chart on the S&P 500 is showing a possible breakout, while the weekly chart is showing support from the upper Keltner line at 1669.  The 2 weekly opening range for the next six months has also been exceeded. Until some sign of sustained weakness, the weekly outlook remains bullish.

Analysis of the S&P 500