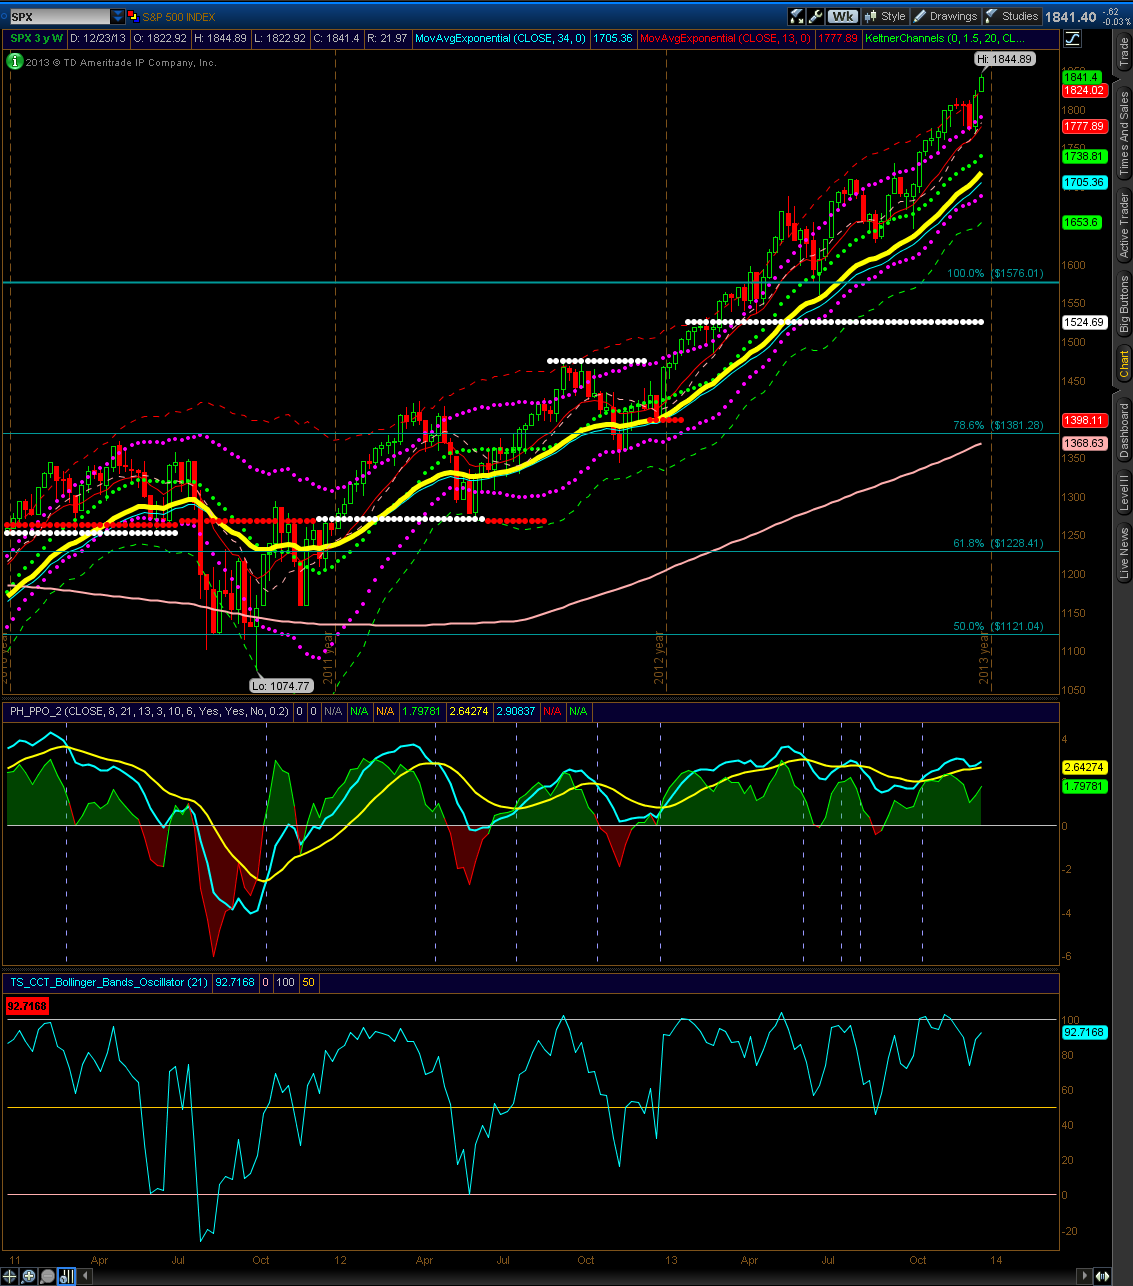
The S&P 500 Weekly is showing another close near new highs.
Until sustained weakness is shown in the market, the weekly outlook remains bullish.
The S&P 500 Weekly is showing another close near new highs.
Until sustained weakness is shown in the market, the weekly outlook remains bullish.
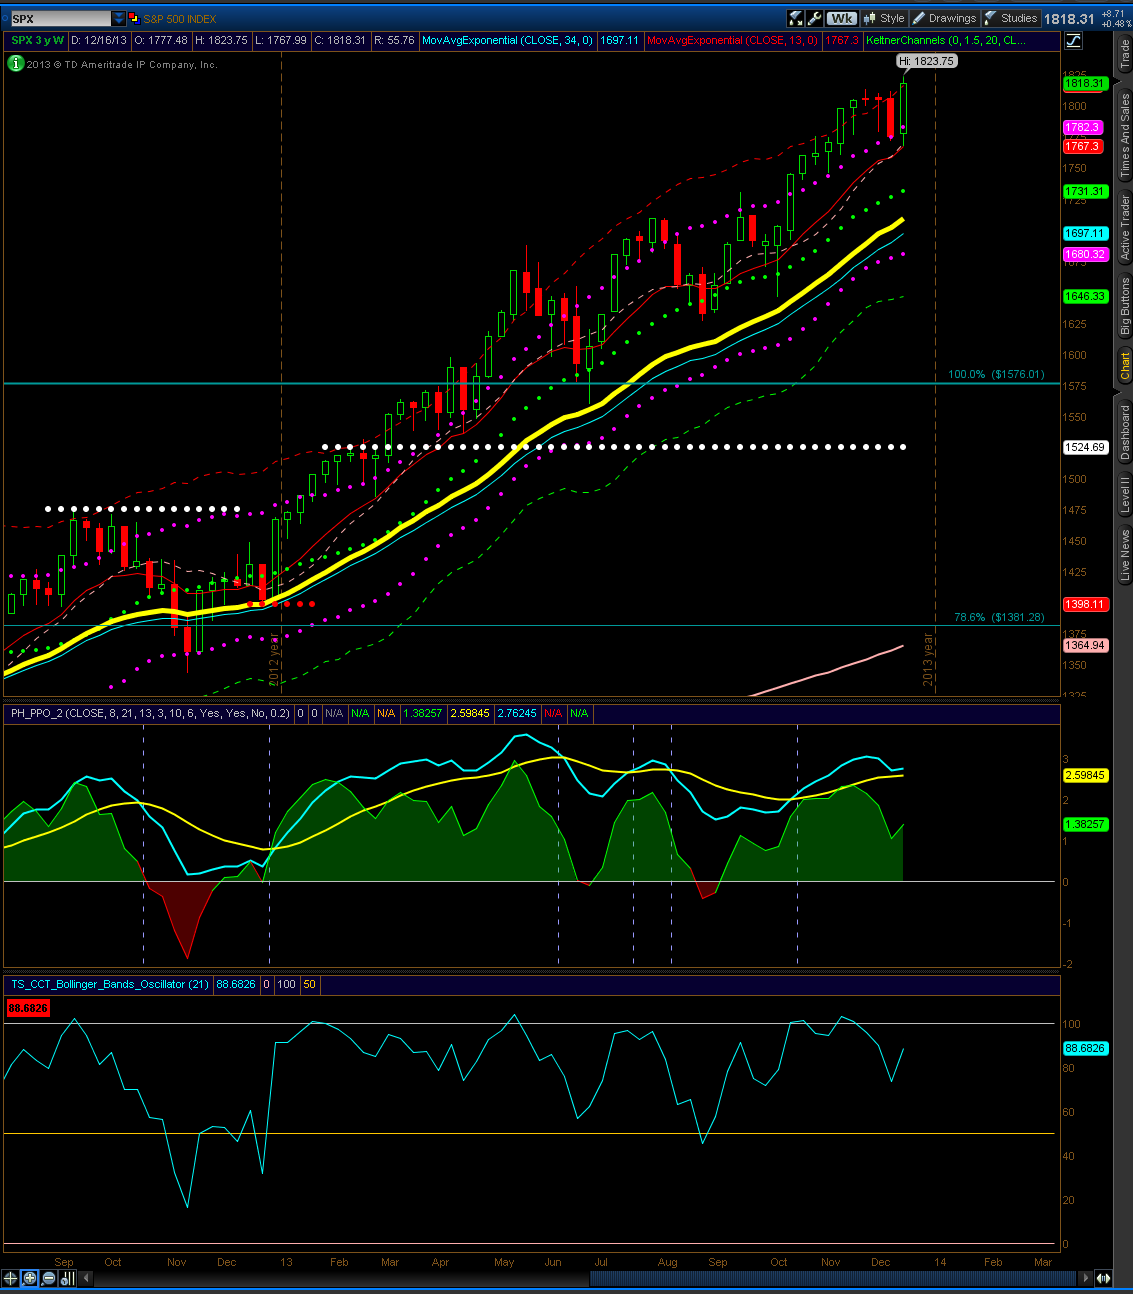
The S&P 500 weekly made new highs. Support near 1782 was tested, but buyers came in and closed the week up.
The weekly outlook remains bullish.
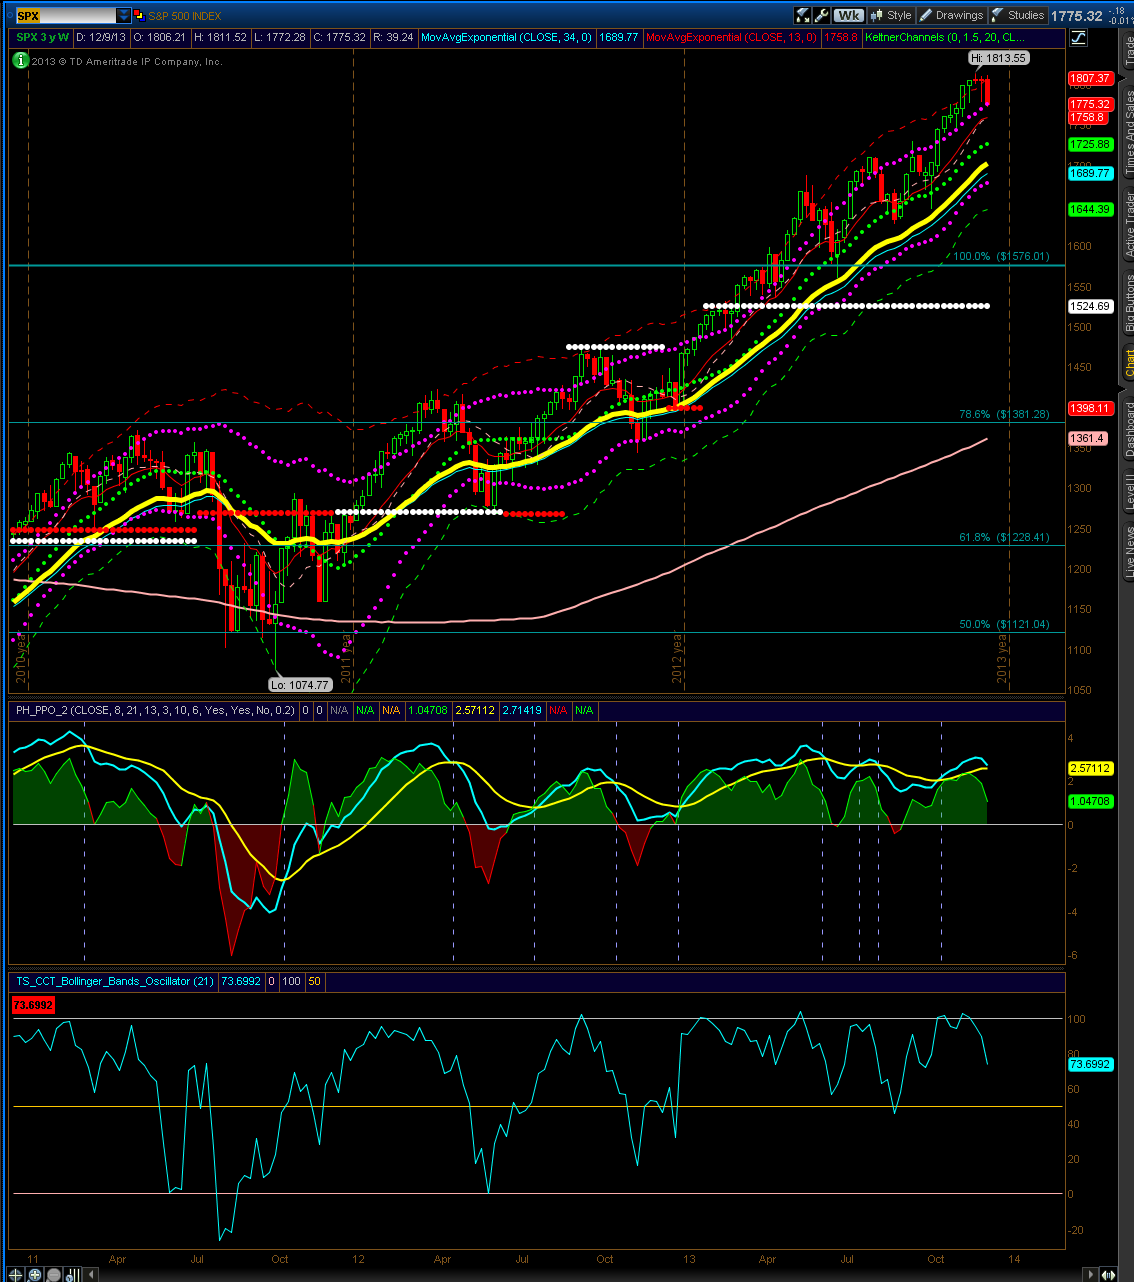
The S&P 500 Weekly closed at the upper keltner line near 1775. A further sell off could test 1725, while a rally could retest highs above 1804. The weekly outlook remains bullish.
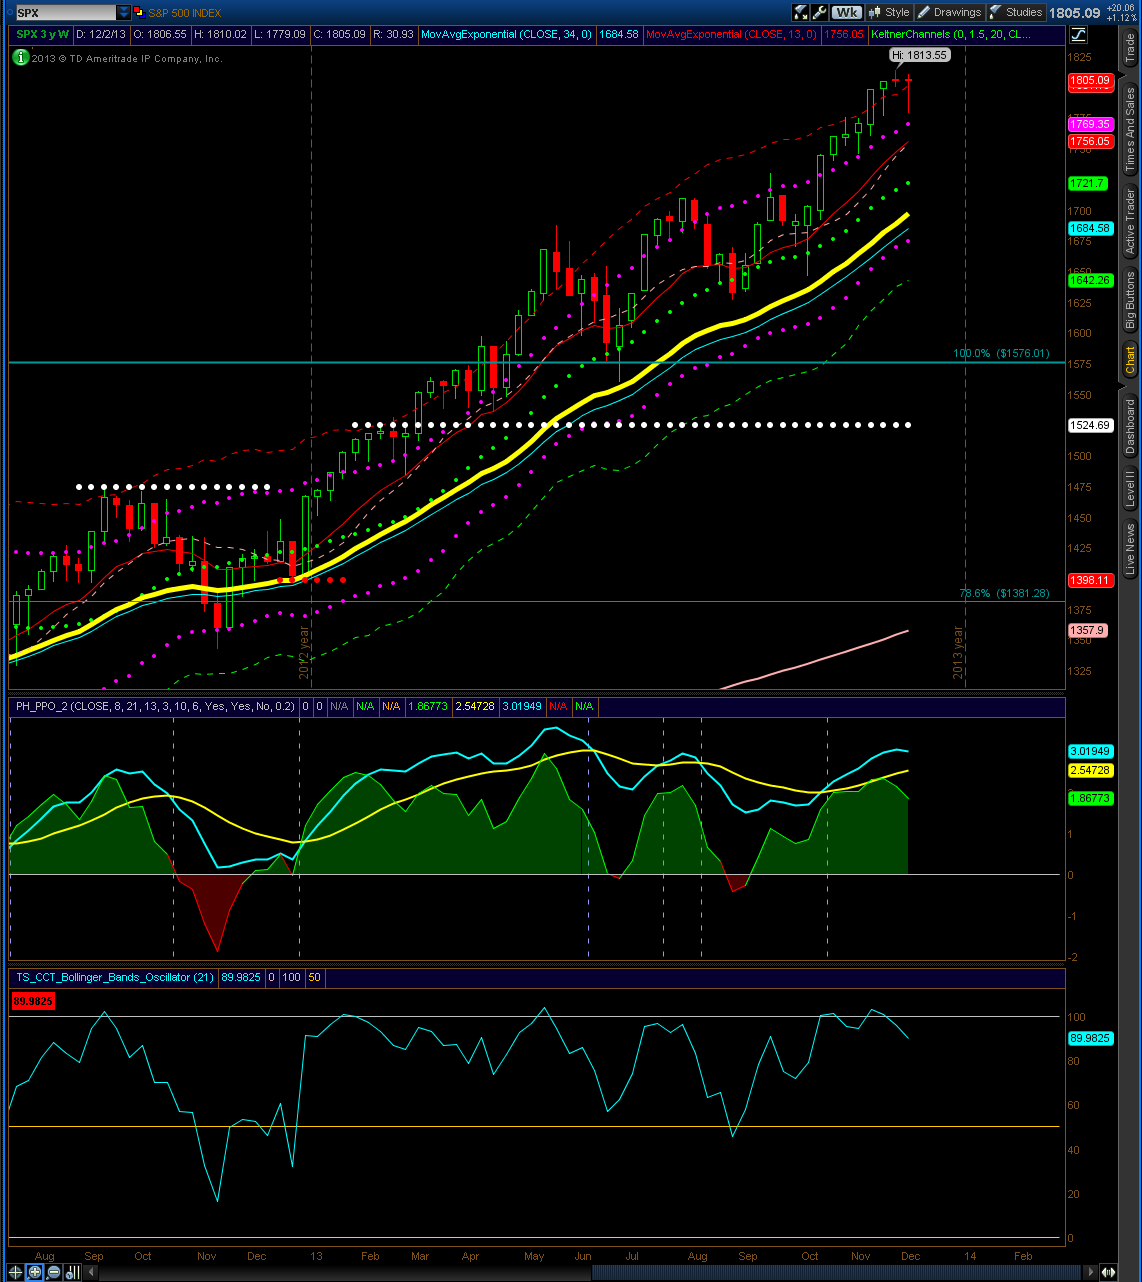
The S&P 500 Weekly is showing a flat close on a weekly basis. The long weekly tail from 11/18 looks similar to this week, which could be interpreted as buying pressure from those levels. If support is sustained above 1805, 1813 or new highs may be tested. On a sell off below 1780, 1769 or lower may be tested.
The weekly outlook remains bullish.

The S&P 500 Monthly is showing new highs being tested along with another close up from last month. Despite being overbought, sustained weakness has not been shown this year with 9 positive closes and 2 negatives closes. Until the monthly chart shows sustained weakness, the monthly outlook remains bullish.