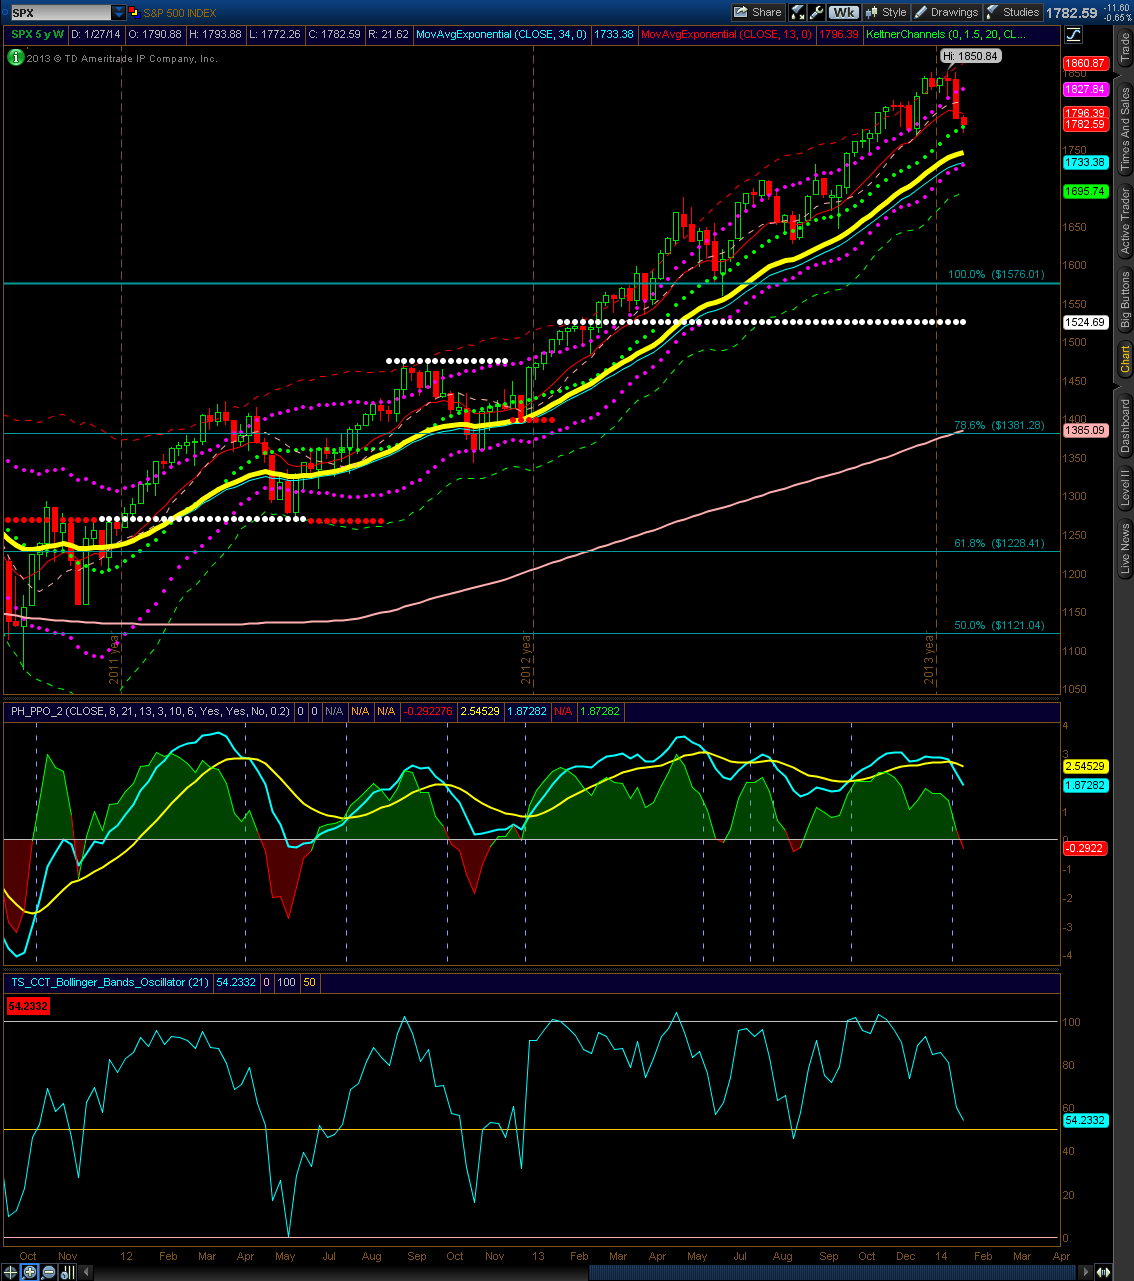
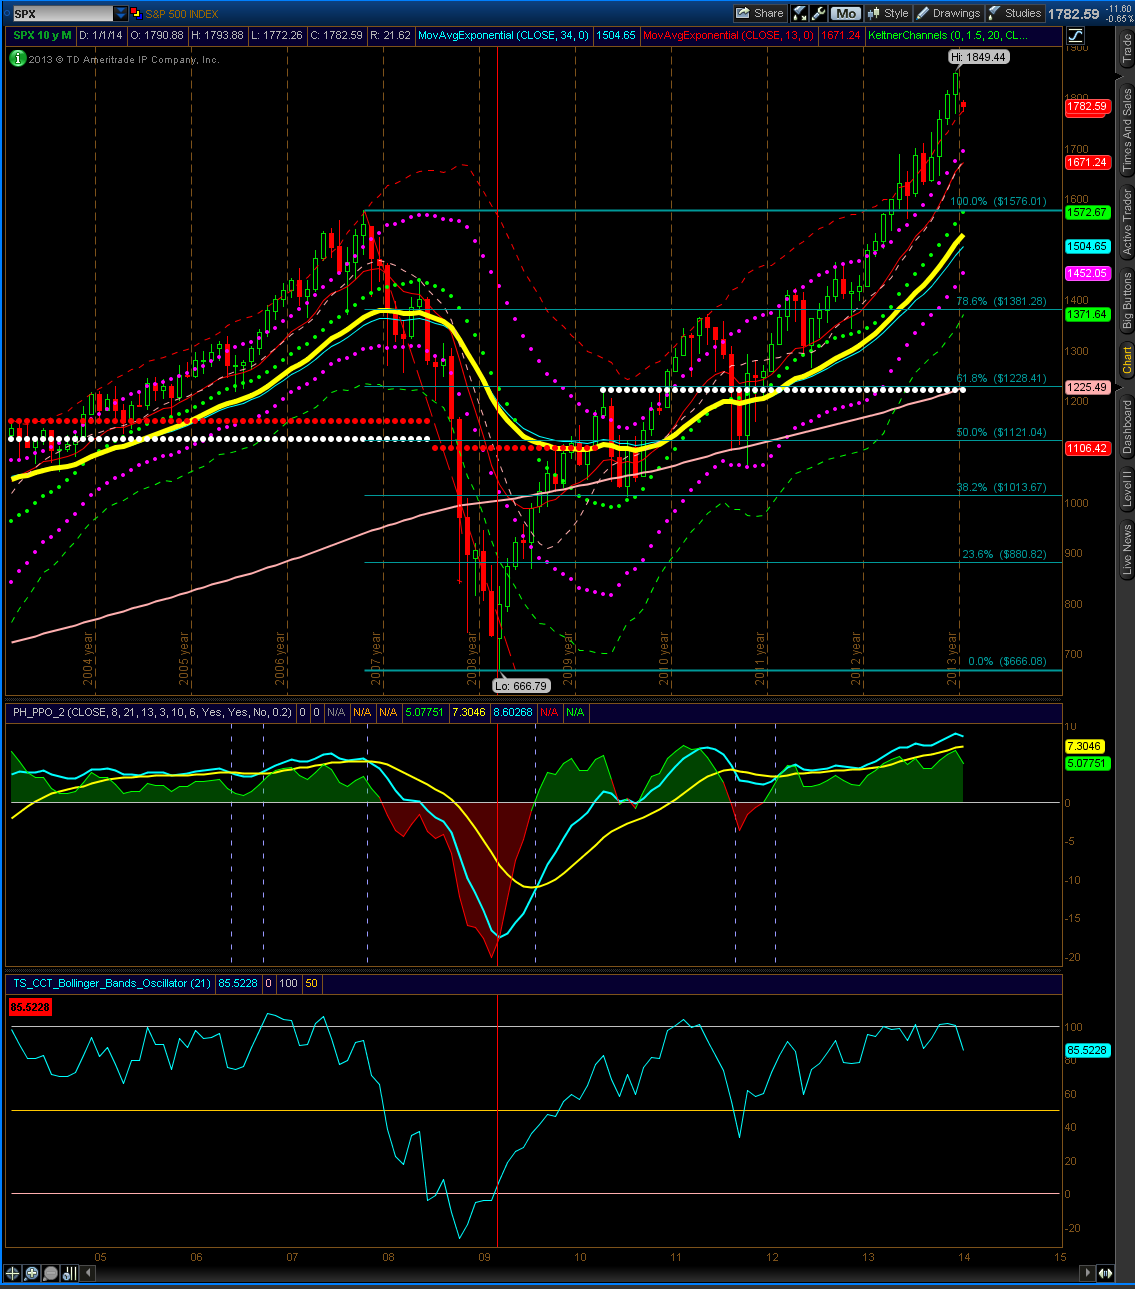
The S&P 500 Monthly candle opened at 1845 and closed at 1782. On further weakness, 1695 may be tested, while a rally may retest highs near 1850. The monthly outlook remains cautiously bullish.
Although on a monthly chart, the outlook clearly remains bullish, the market has closed beneath the opening range for the S&P 500 cash, which is the following:
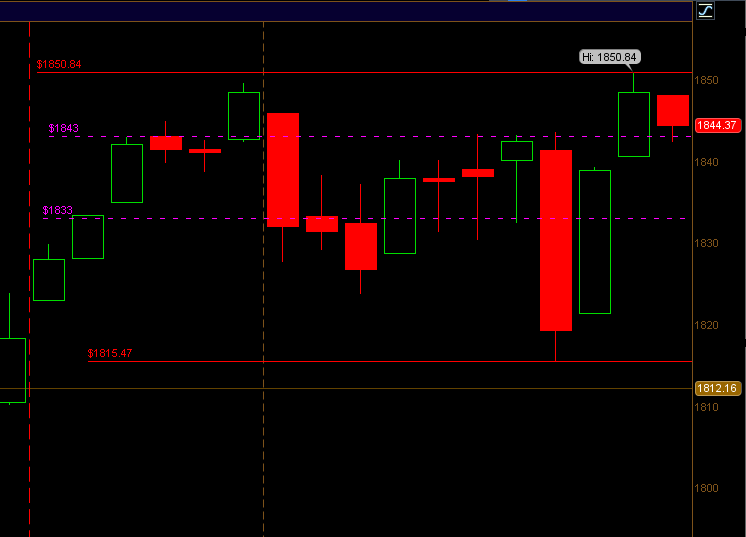
- Pivot High – 1843
- Pivot Low – 1832
- Opening Range High – 1851
- Opening Range Low – 1815
As long as the market remains below 1815, a sell off for the first half of the year remains a strong possibility.