S&P 500 Monthly Review June 2014

The S&P 500 monthly is showing another close above the upper Keltner line. This month also marks the end of the first half of the year, which ended 110 points above the opening range.

In the event the market continues upward, 2138 should be tested, while a sell off could retest 1820 or lower.

The monthly outlook remains bullish.

The Death of the Retail Trader

It seems like main stream investing is on the decline. I’m not sure if it’s a sign of the times or a sign that the current bull market is still in it’s infancy. I always like to keep in mind that correlation does not mean causation.

CNBC Viewership Drops To Lowest Since 1997, Cramer Has Worst Month Ever  – 6/24/2014, zerohedge.com

CNBC Core Viewership Drops To Fresh Two Decade Low In November, Lowest Since 1993 – 11/26/2013, zerohedge.com

CNBC’s Ratings Decline is Bullish News for Investors – 5 / 2 / 2013, US News

Ratings Way Down For CNBC’s Marquee Shows And Stars: NY Daily News – 4 / 29 / 2012, deadline.com

CNBC isn’t the only network for financial news, but it’s one of the main sources for retail.


St. Louis Fed Leading Index

Saw this post over at the TAMU Real Estate Blog, and found it interesting in comparison to all the bearish rhetoric I’ve been seeing lately.

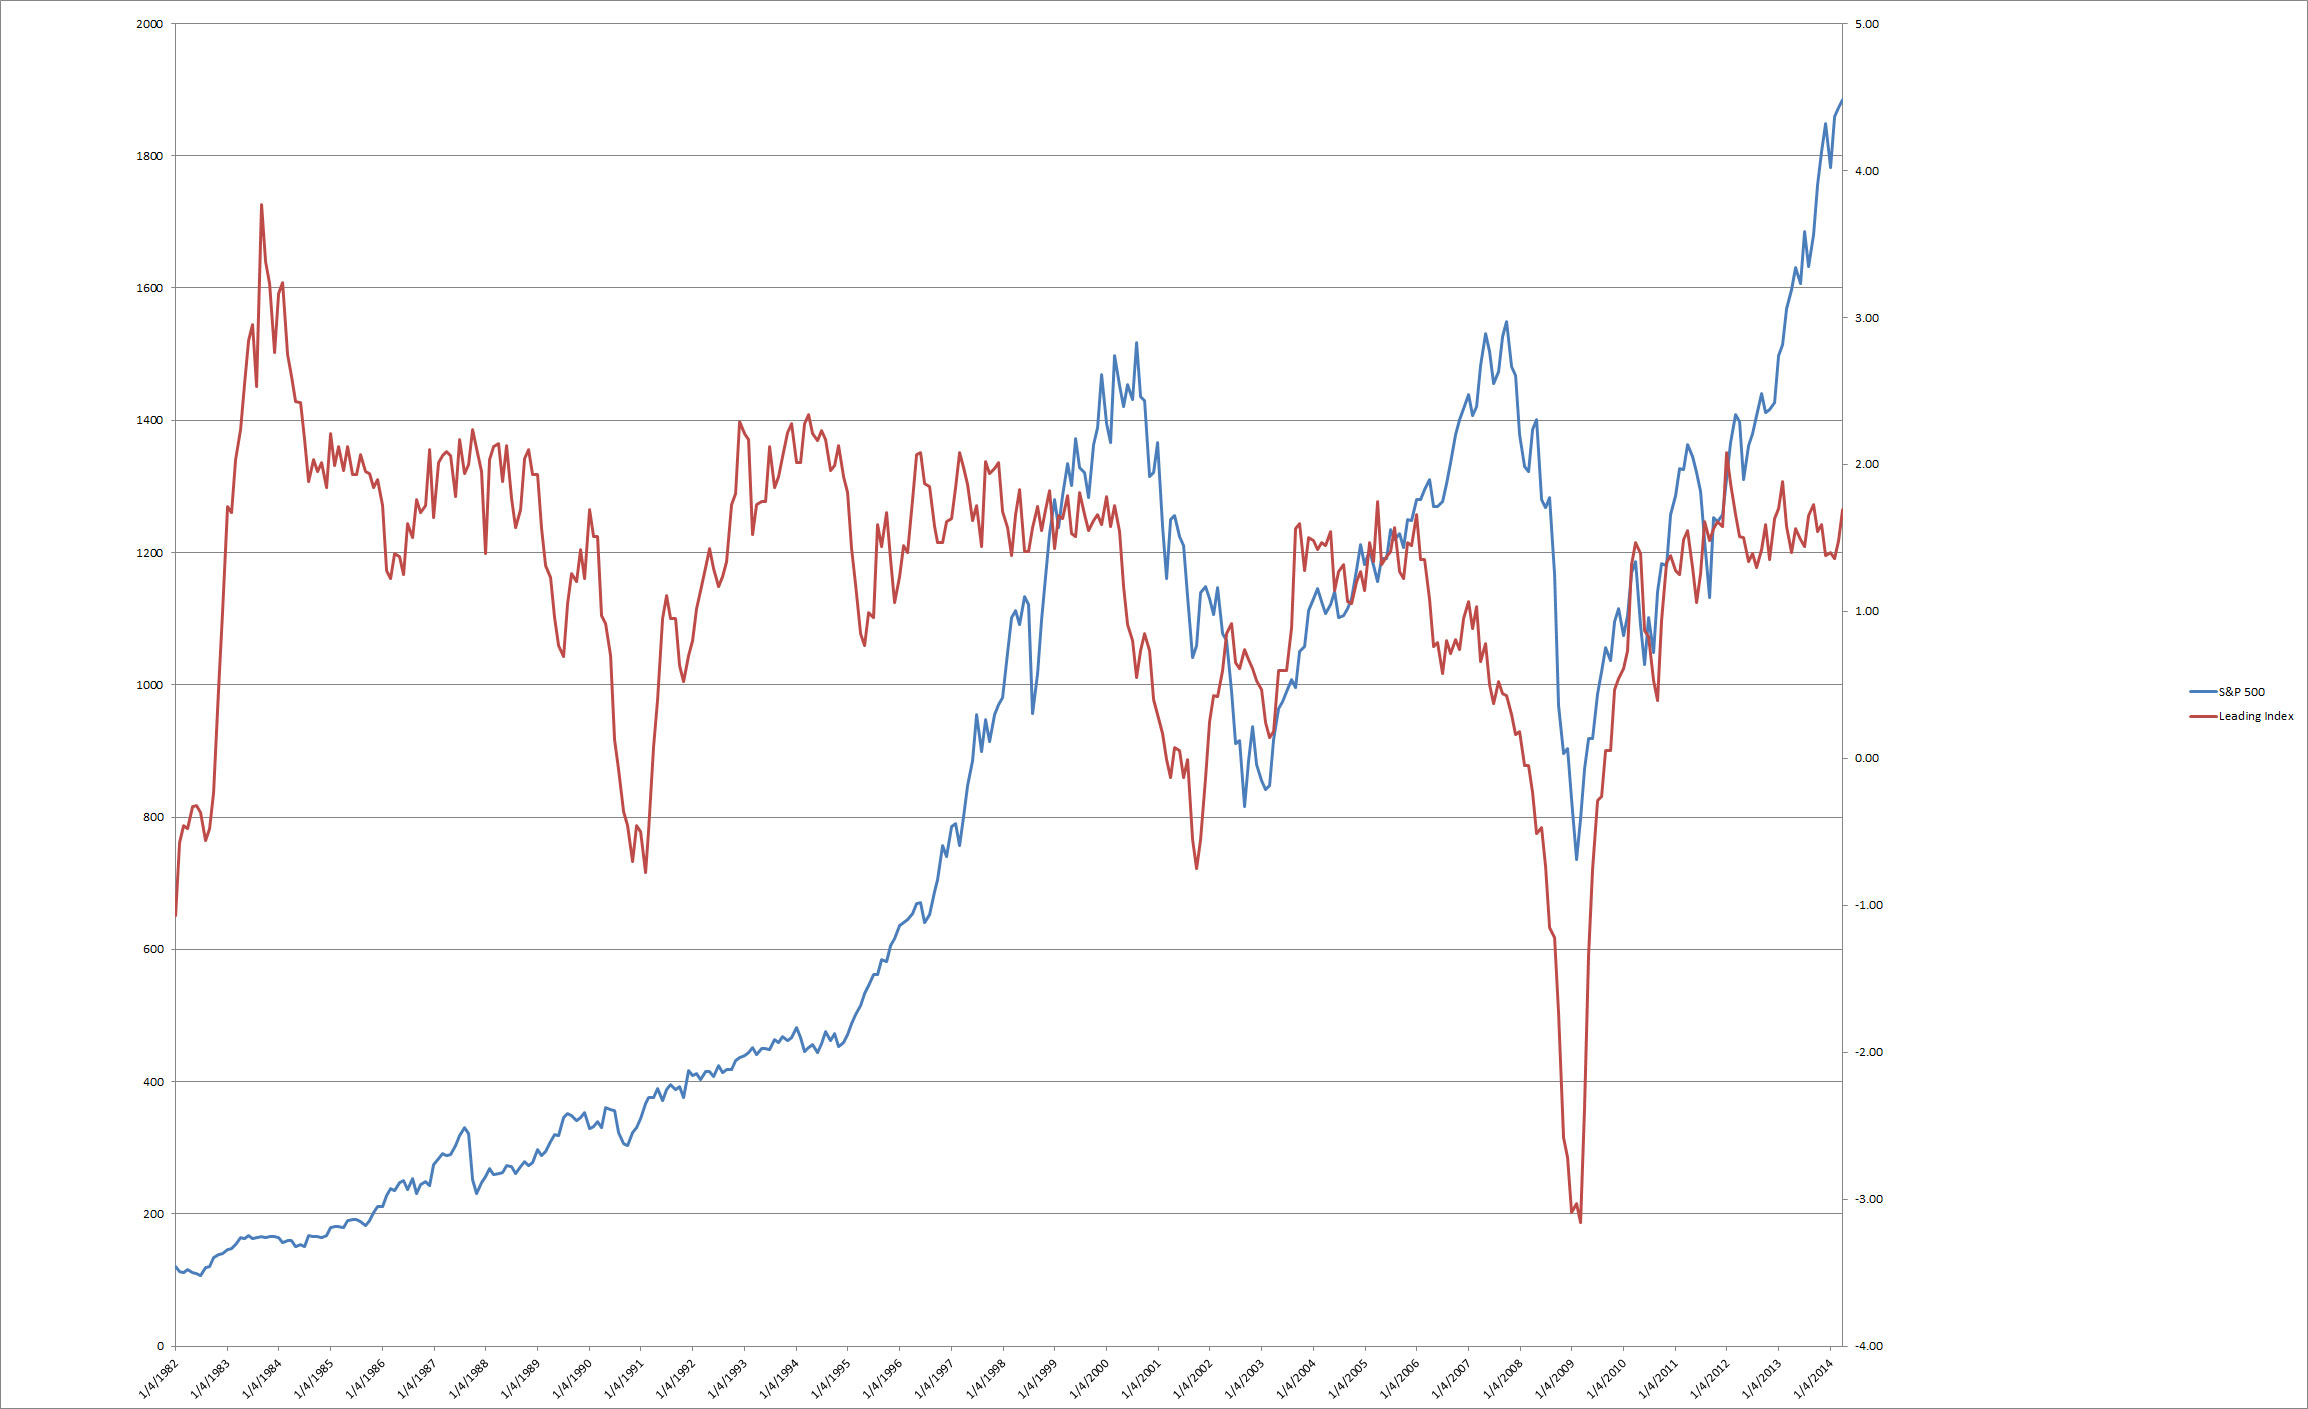
The following is the St. Louis Fed leading index for the USA.

fed.leading.index

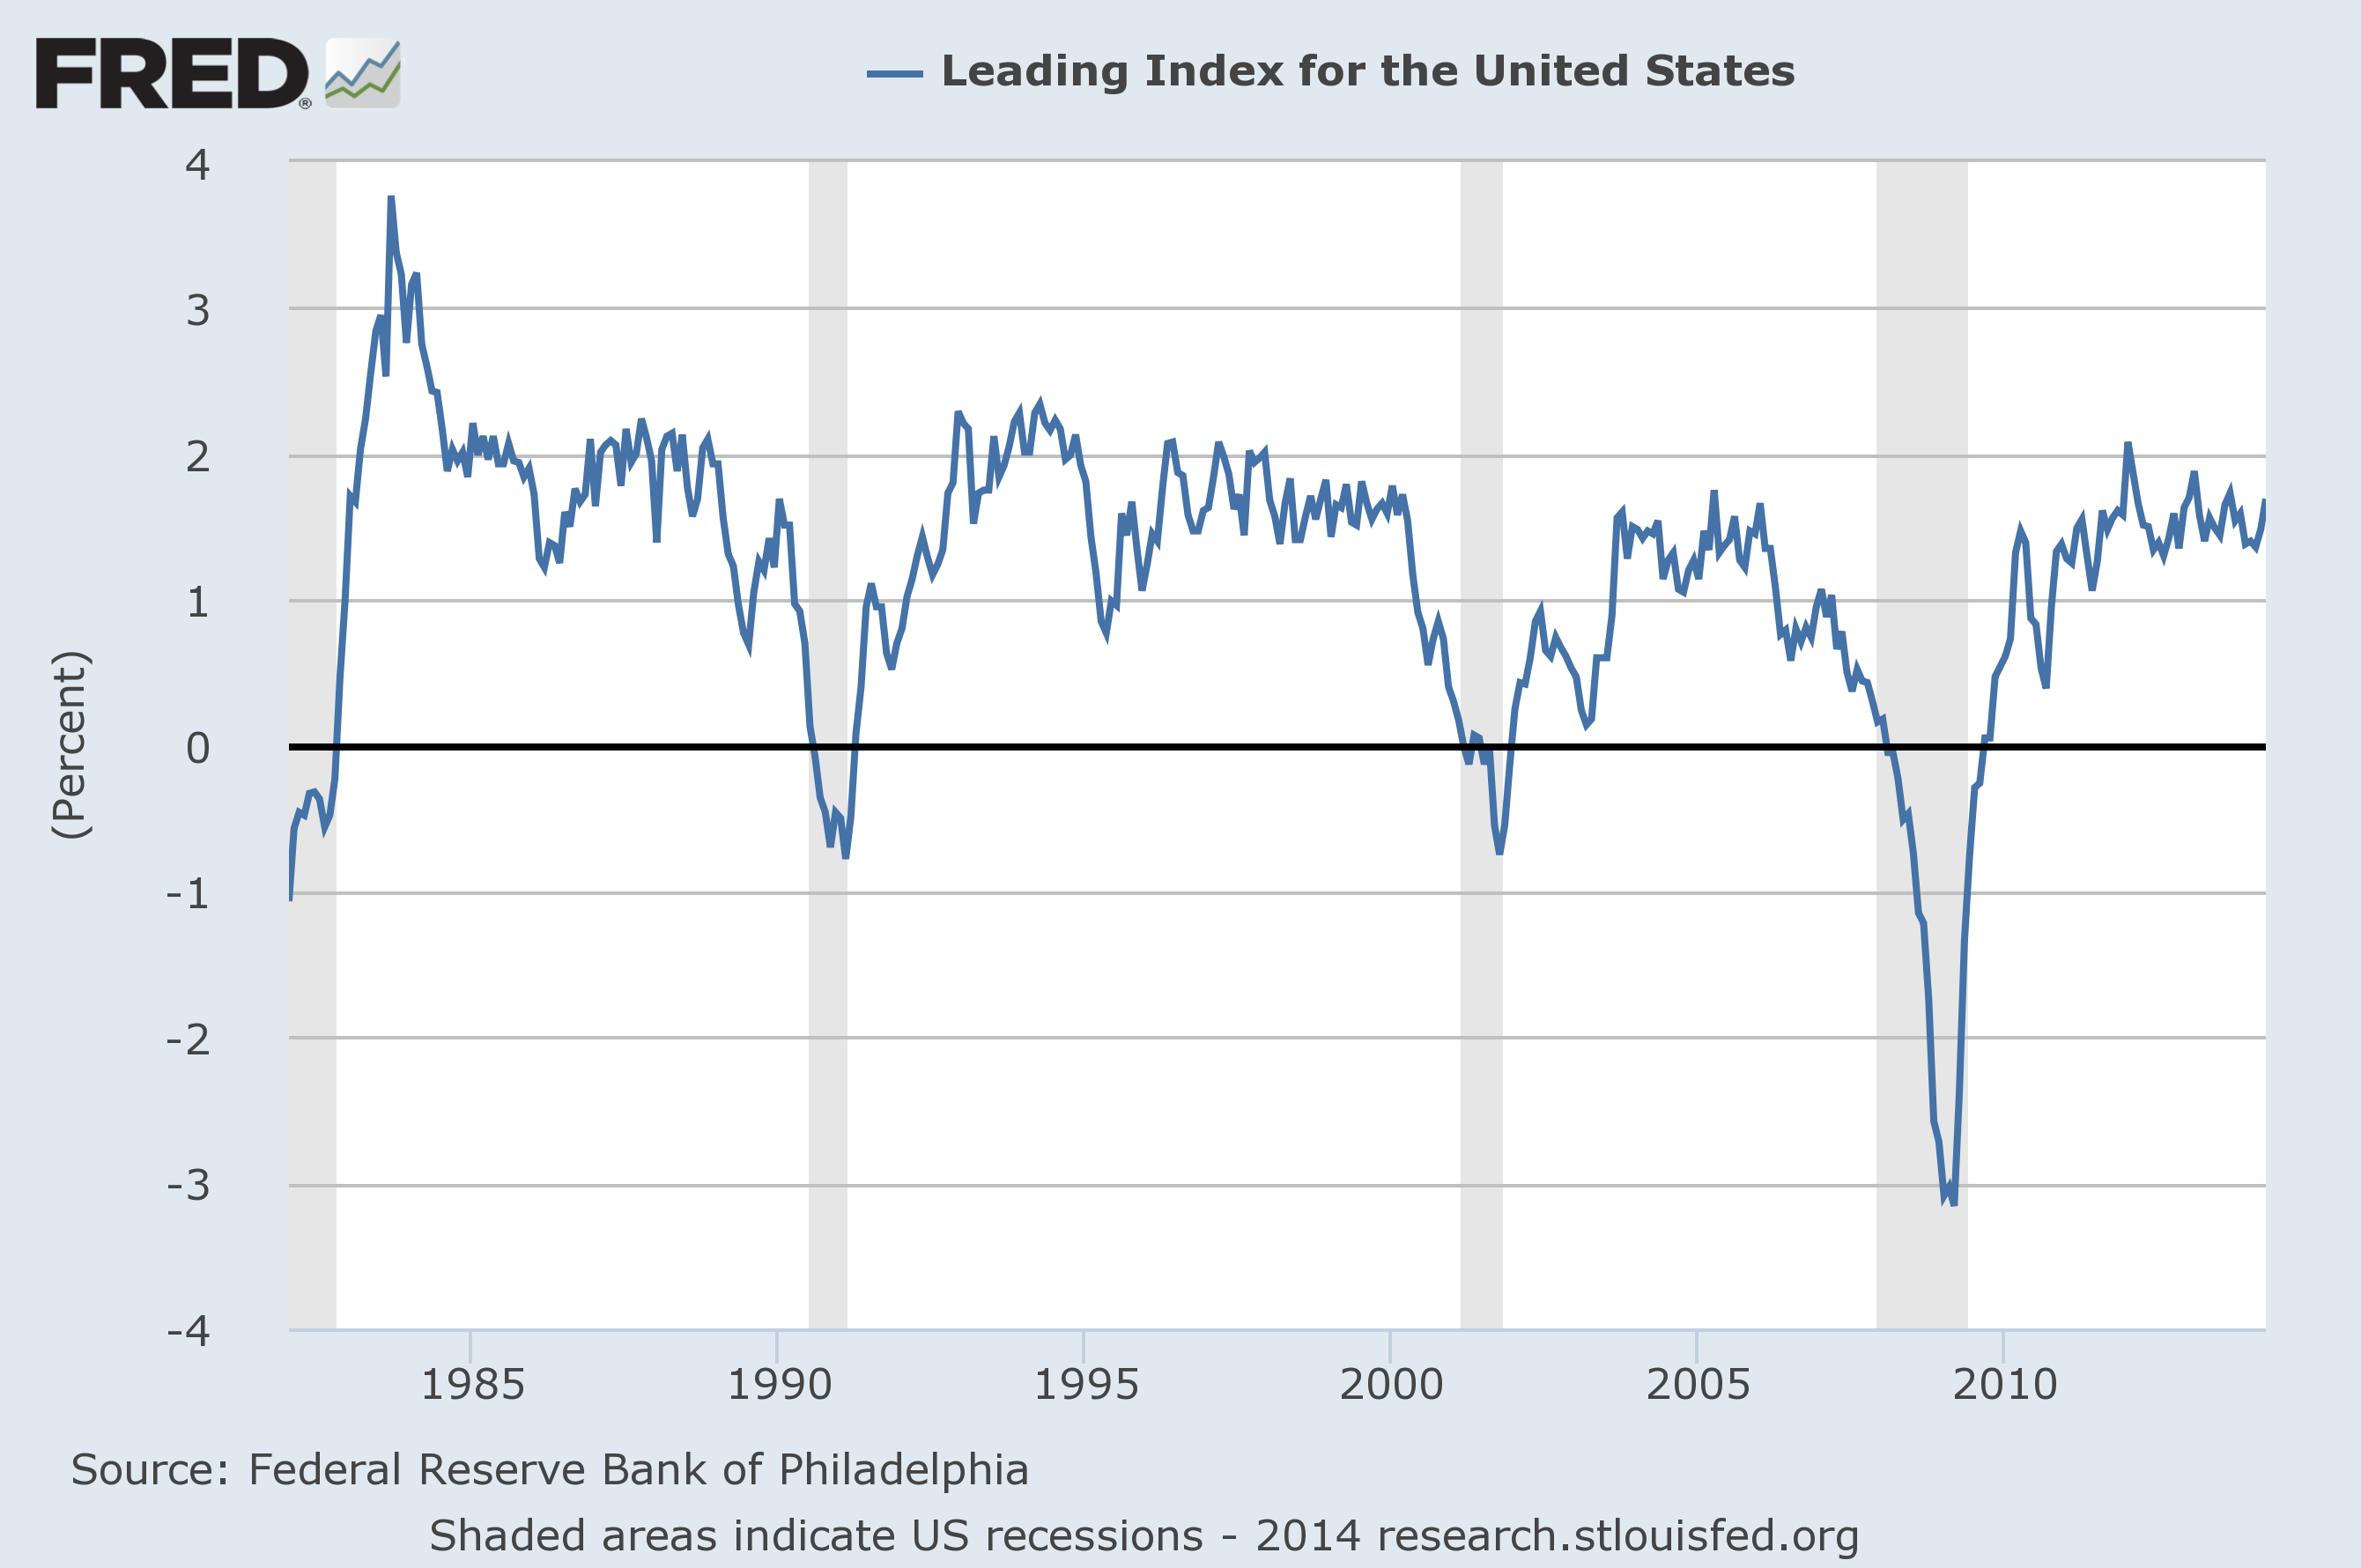
Does it correlate or at least lead the S&P 500?

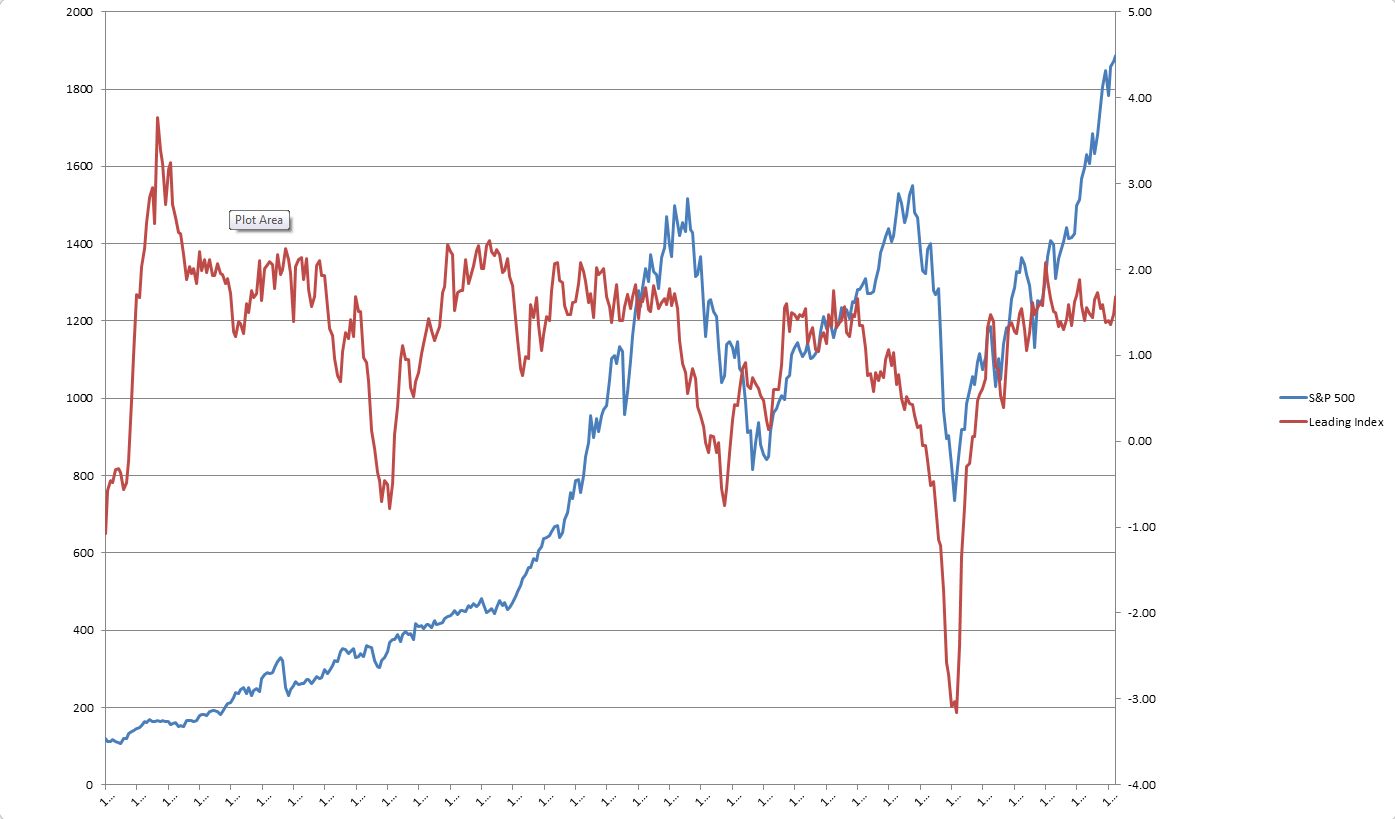
The blue line is the S&P 500, while the red is the leading index. There is a very close correlation between the recent bear / bull markets on the S&P 500.  A monthly close below 1 on the leading index suggests a recession is coming, while above 1 suggests economic expansion. The leading index has stayed above 1 since October 2010.

The index does lead the S&P 500 by a few months, however, it hasn’t correlated this much until the 1990s.