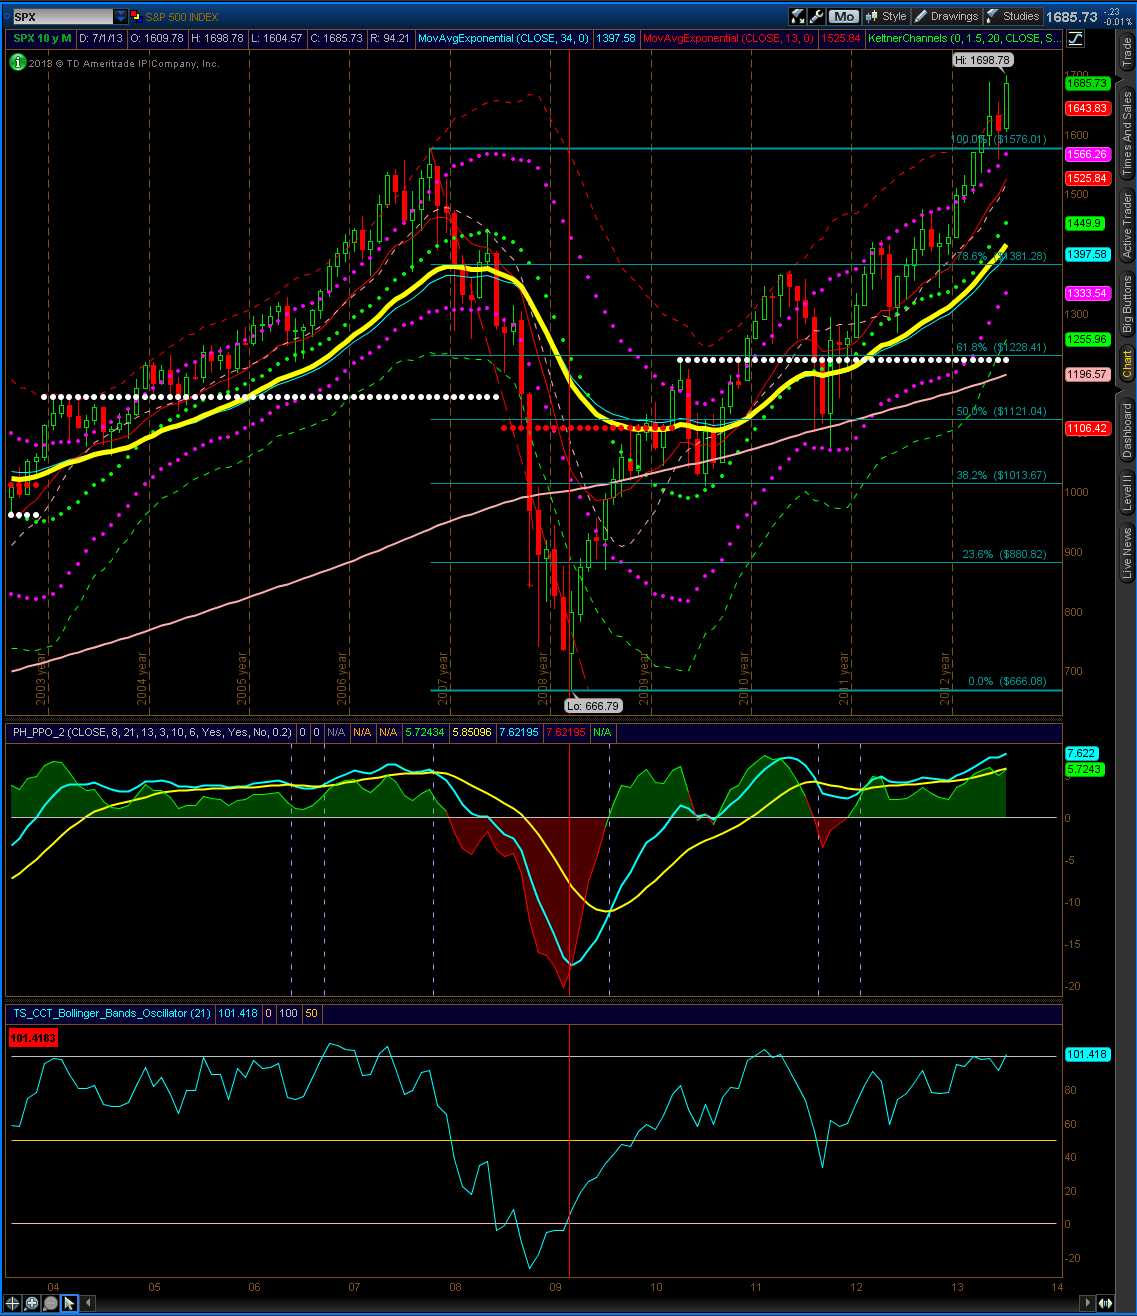
The S&P 500 tested new highs in July and closed above June’s range. Until the monthly charts show sustained weakness, the monthly outlook remains bullish.
The S&P 500 tested new highs in July and closed above June’s range. Until the monthly charts show sustained weakness, the monthly outlook remains bullish.

The S&P 500 weekly is showing a close slightly below last week. In the event of a rally, I expect 1714 to be tested, while a sell off may retest the 1650s. The market also closed above the 2 week opening range for the 2nd consecutive week. The daily chart is showing support near 1684.
Until the market shows sustained weakness, my outlook remains bullish.
The S&P 500 weekly is showing a new all time high. The daily chart on the S&P 500 is showing a possible breakout, while the weekly chart is showing support from the upper Keltner line at 1669. The 2 weekly opening range for the next six months has also been exceeded. Until some sign of sustained weakness, the weekly outlook remains bullish.
Here are some additional opening ranges for other assets.
CL
ZN
The S&P 500 weekly is showing a close near previous highs at 1687. If the highs are broken, 1703 could be tested, while a sell off could retest 1662 or lower. My weekly outlook is bullish.
The opening range for the next six months has completed. They are the following:
ES Futures:
S&P 500 Cash
I will be watching these numbers closely in the weeks to come.