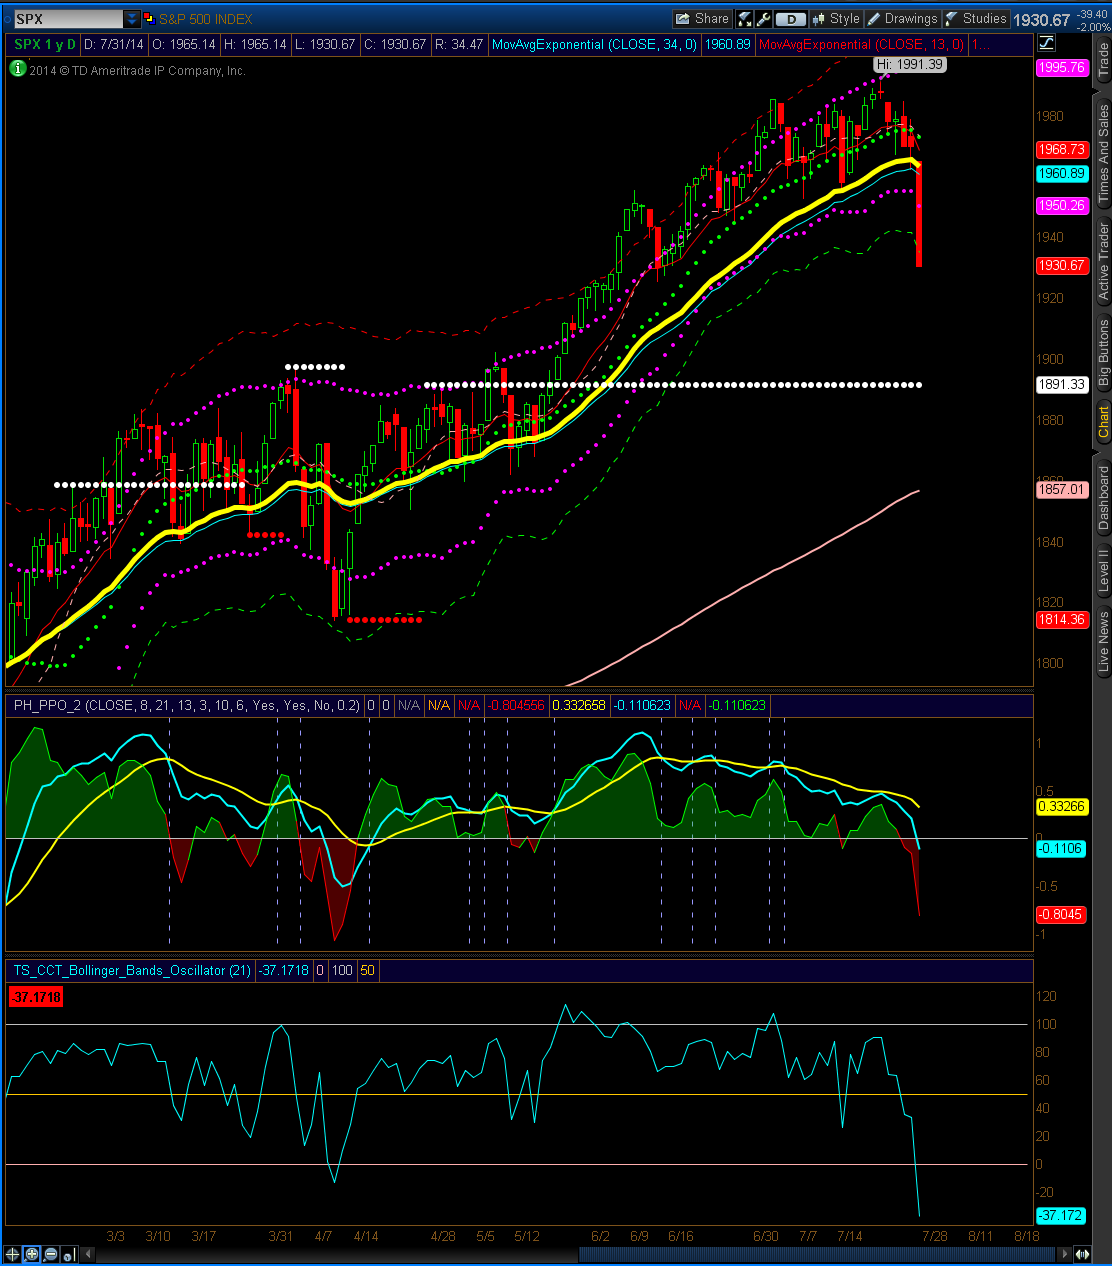
The S&P 500 daily closed below the six month opening range for the second half of the year. If the market trades below 1953 for a few days, this would confirm a sell signal.
The S&P 500 daily closed below the six month opening range for the second half of the year. If the market trades below 1953 for a few days, this would confirm a sell signal.
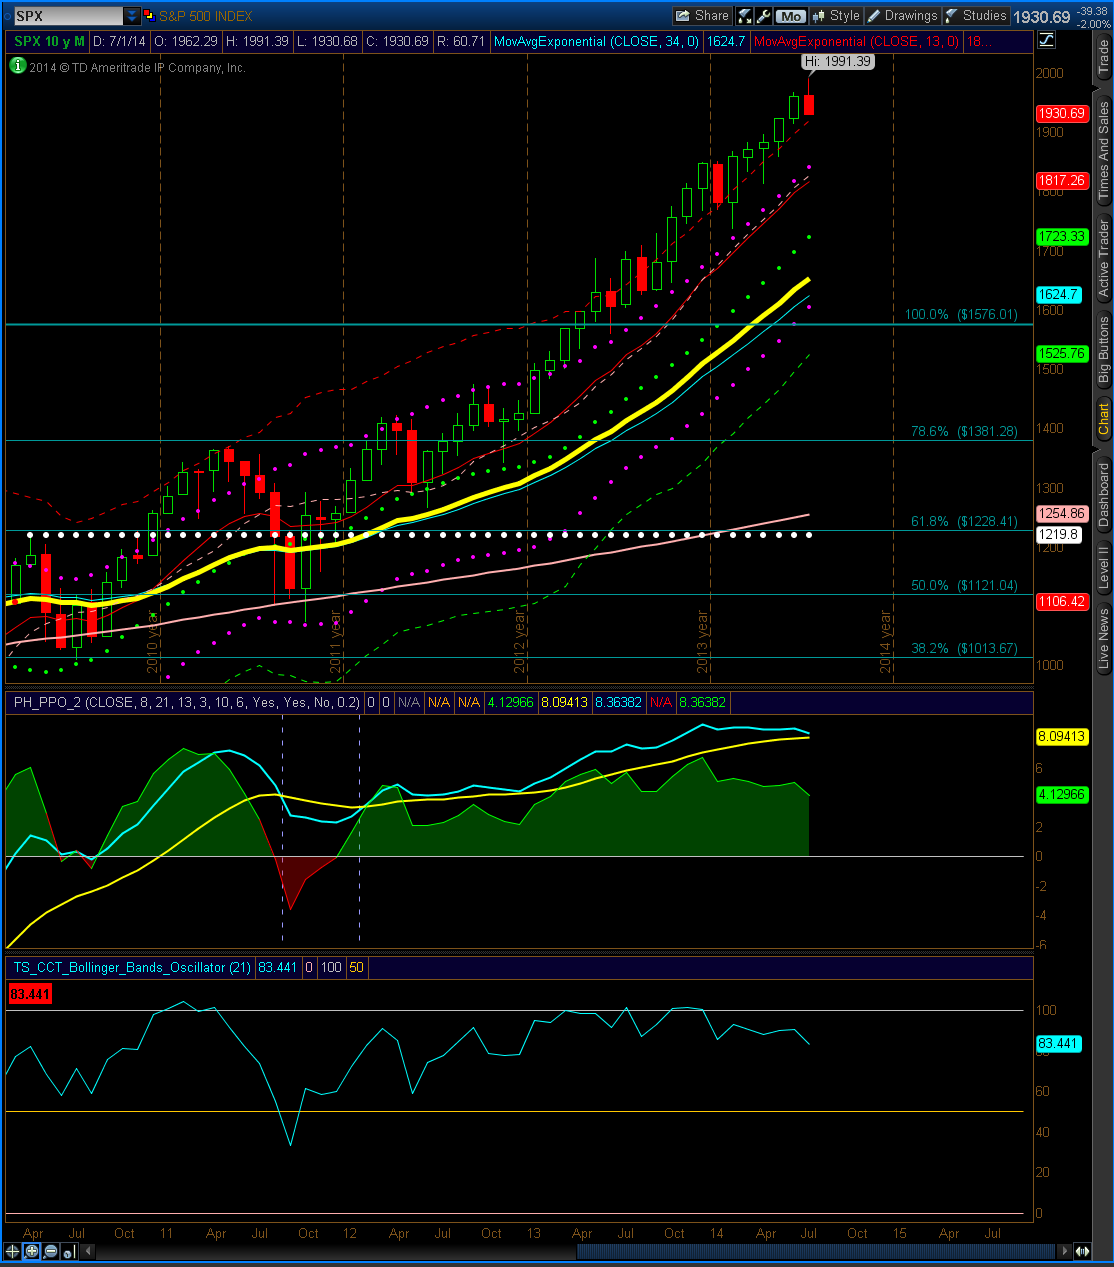
The S&P 500 monthly is showing another close above the upper keltner line. This is the first negative monthly close in five months. Until the market shows sustained weakness, the monthly outlook remains bullish.
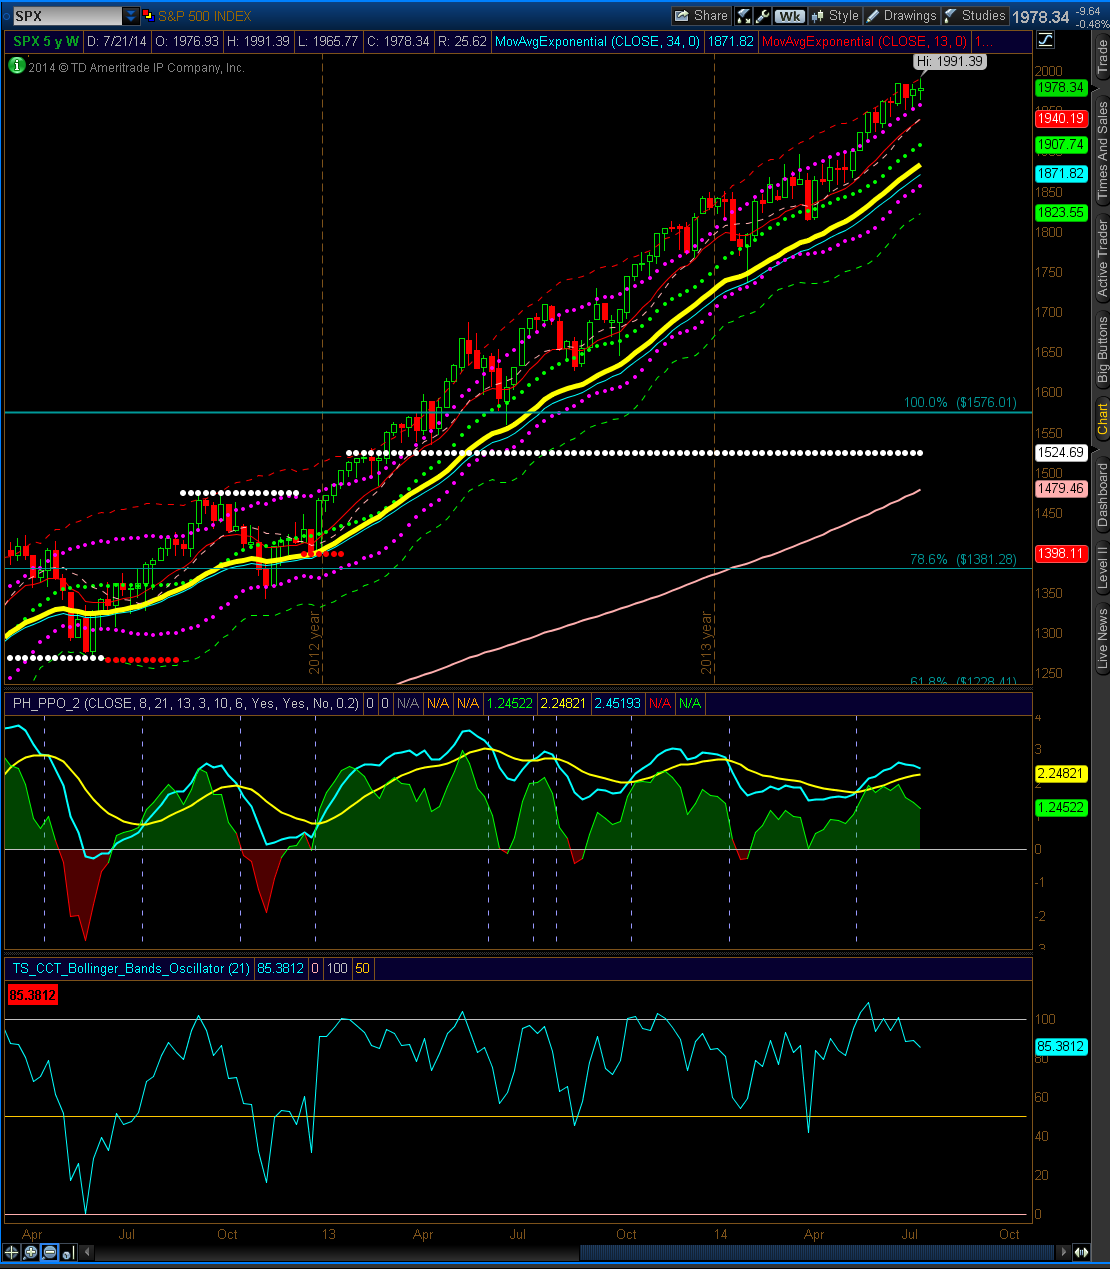
The S&P 500 weekly is showing another close inside the range of the past few weeks. A consolidation before a possible top or break out to higher prices may be forming here. Until the market shows sustained weakness, the weekly outlook remains bullish.
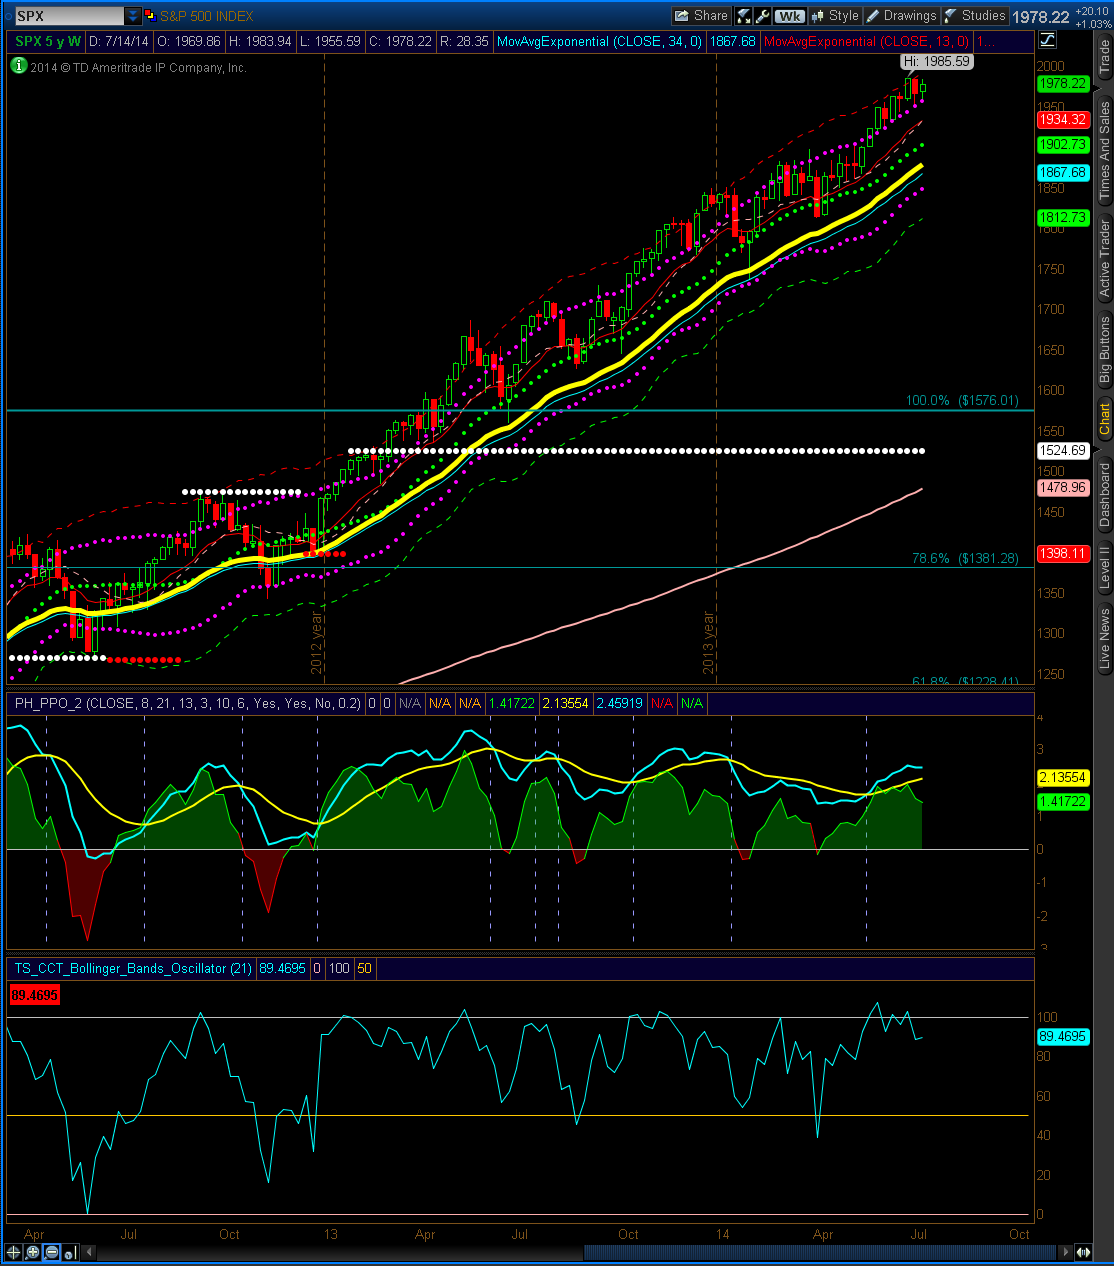
The S&P 500 weekly is showing another close above the upper Keltner line. Despite the sell off on Thursday, buyers came in and closed the week positive.
The opening range for the next six months has been set. The Russell 2000 index broken below it’s range [RUT], while the weekly chart for the Nasdaq 100 is showing a potential breakout at highs and a slight close above the range.
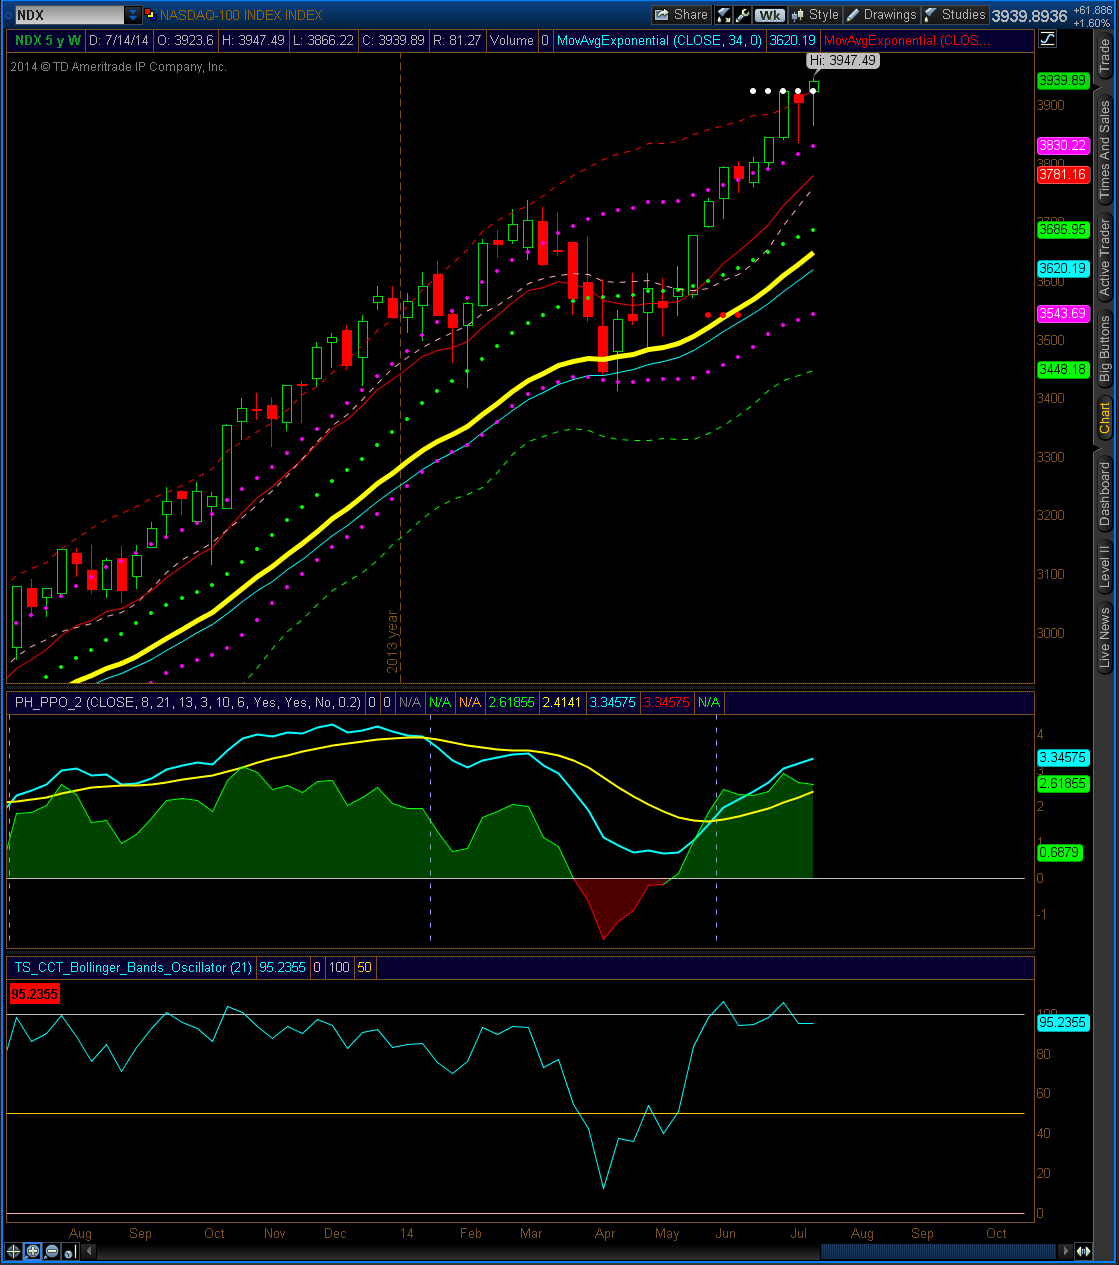
Support forming above 3923 would confirm the breakout to the upside, while a sustained break below that level could be a top.
The weekly outlook for the S&P 500 remains bullish.
Comparing the activities of institutions versus retail can be interesting. One indicator of retail data, TD Ameritrade’s IMX, shows that flows have been flat to down despite the new highs being made in the S&P 500 index.
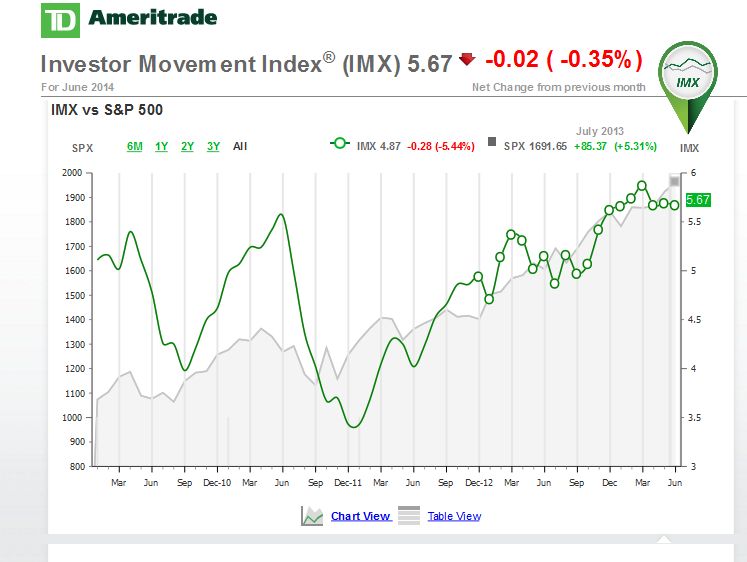
In contrast, money flows into mutual funds and by foreign institutions has increased.